Statistics & Probability Projects for High School: Real World Data & Modeling
Statistics is where math becomes evidence.
Students move beyond solving equations and begin analyzing patterns, interpreting variability, testing claims, and modeling uncertainty. But data analysis only sticks when it feels authentic.

That’s why statistics and probability projects are so powerful. When students collect real data, analyze trends, compare theoretical and experimental probability, and evaluate risk, math becomes investigative.
If you’re looking for engaging statistics projects for high school or real world probability activities, these project-based learning (PBL) ideas bring data to life.
Data Collection & Survey Projects
Statistics begins with meaningful questions.
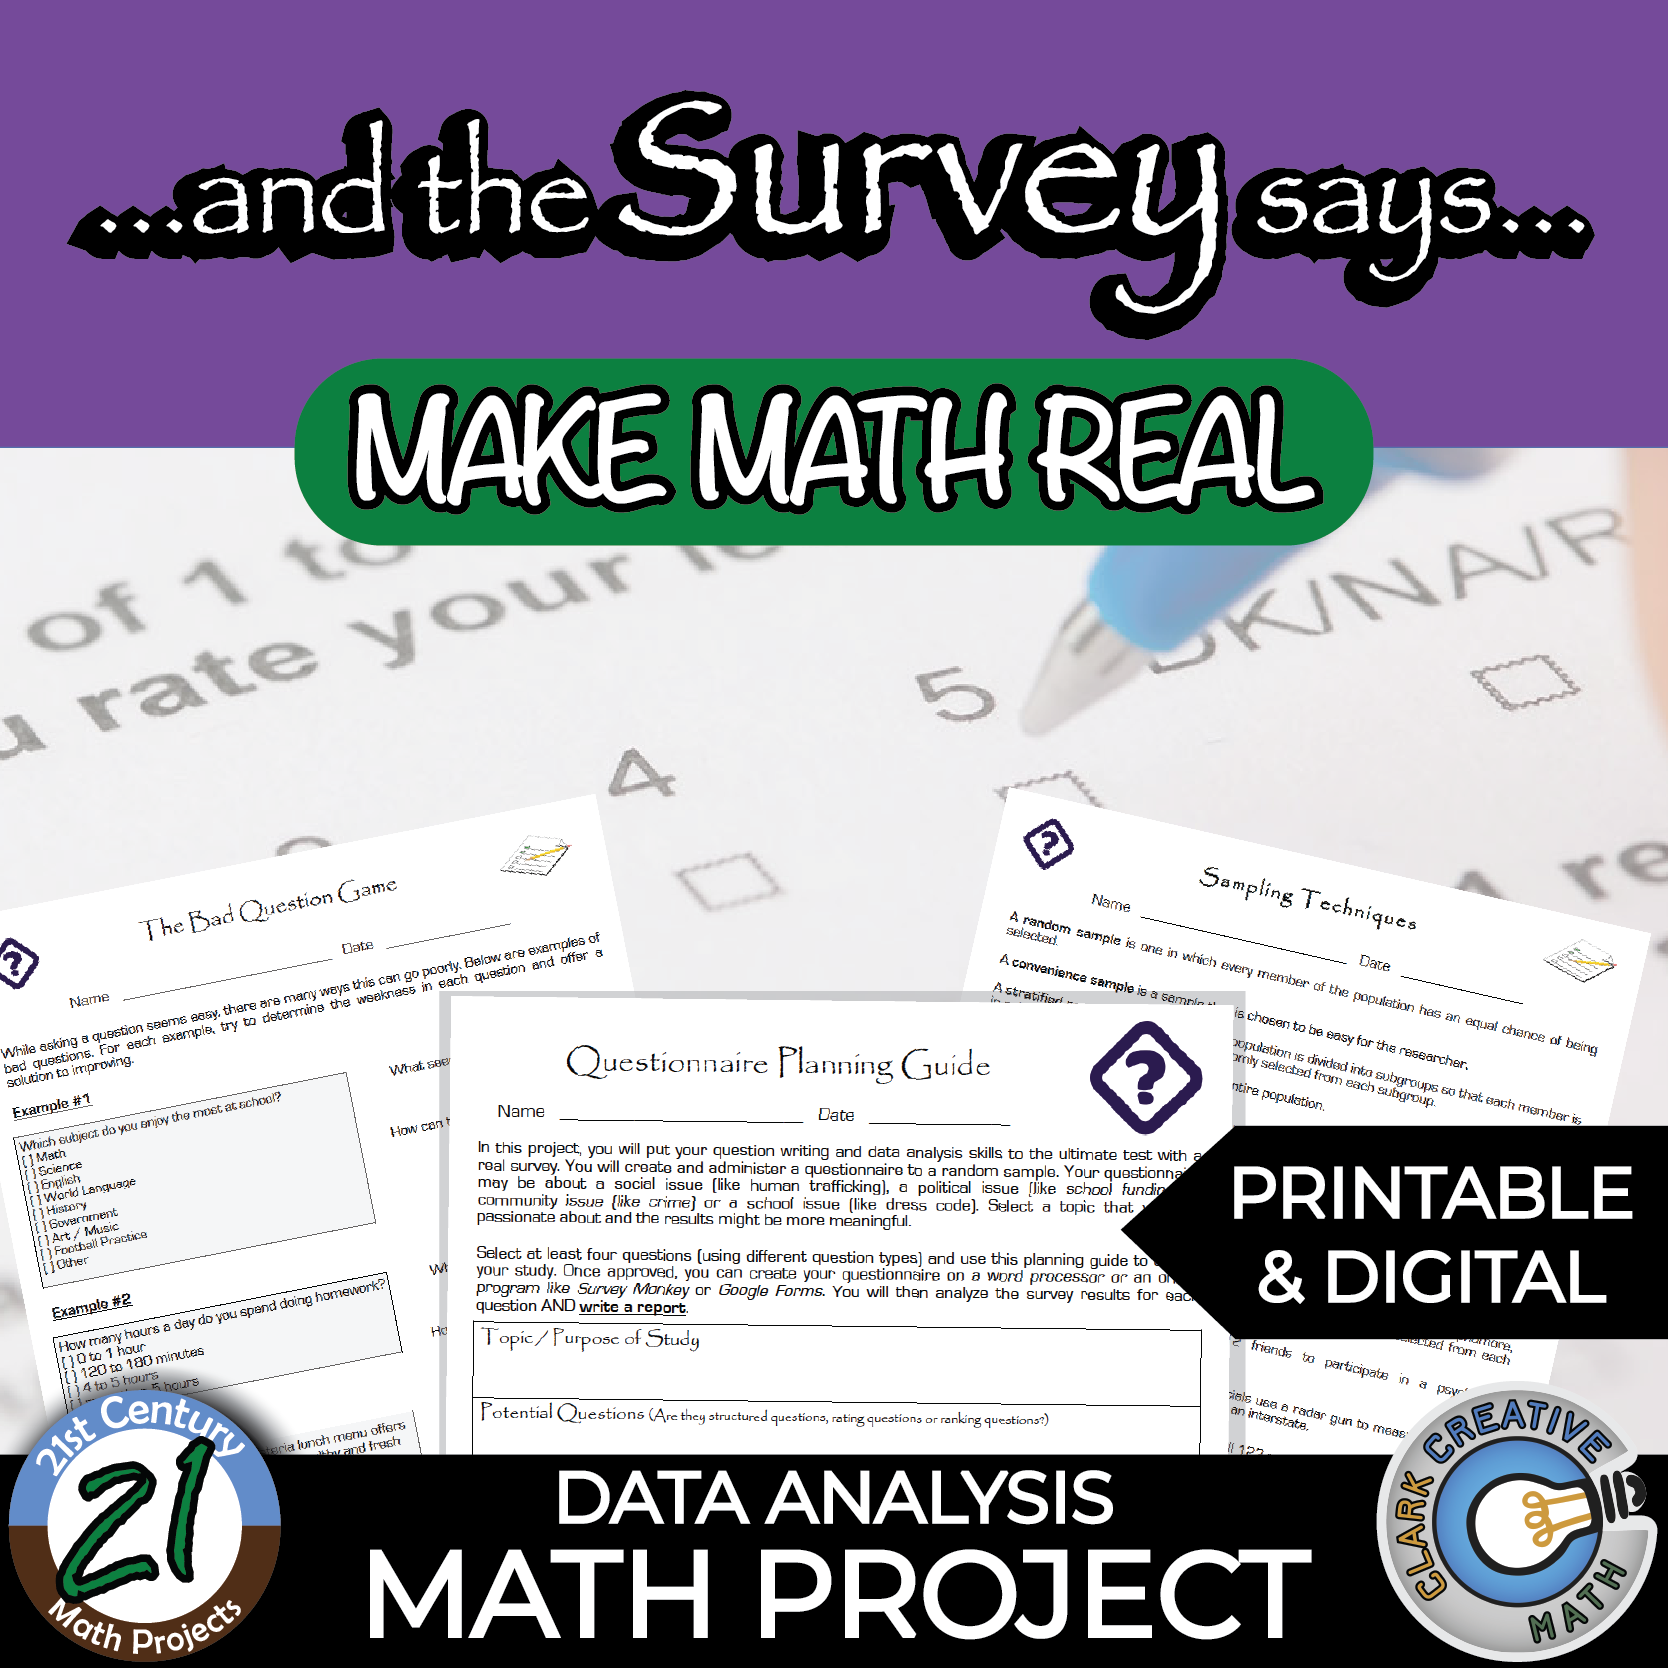
The Survey Says – Quantitative Questionnaire Project
Students design, administer, and analyze their own quantitative surveys.
They must craft measurable questions, collect responses, and interpret results using statistical reasoning.
Concepts Covered:
- Data collection methods
- Sampling
- Measures of center
- Data representation
- Interpretation
This is one of the most authentic statistics projects for high school because students analyze data they generate themselves.
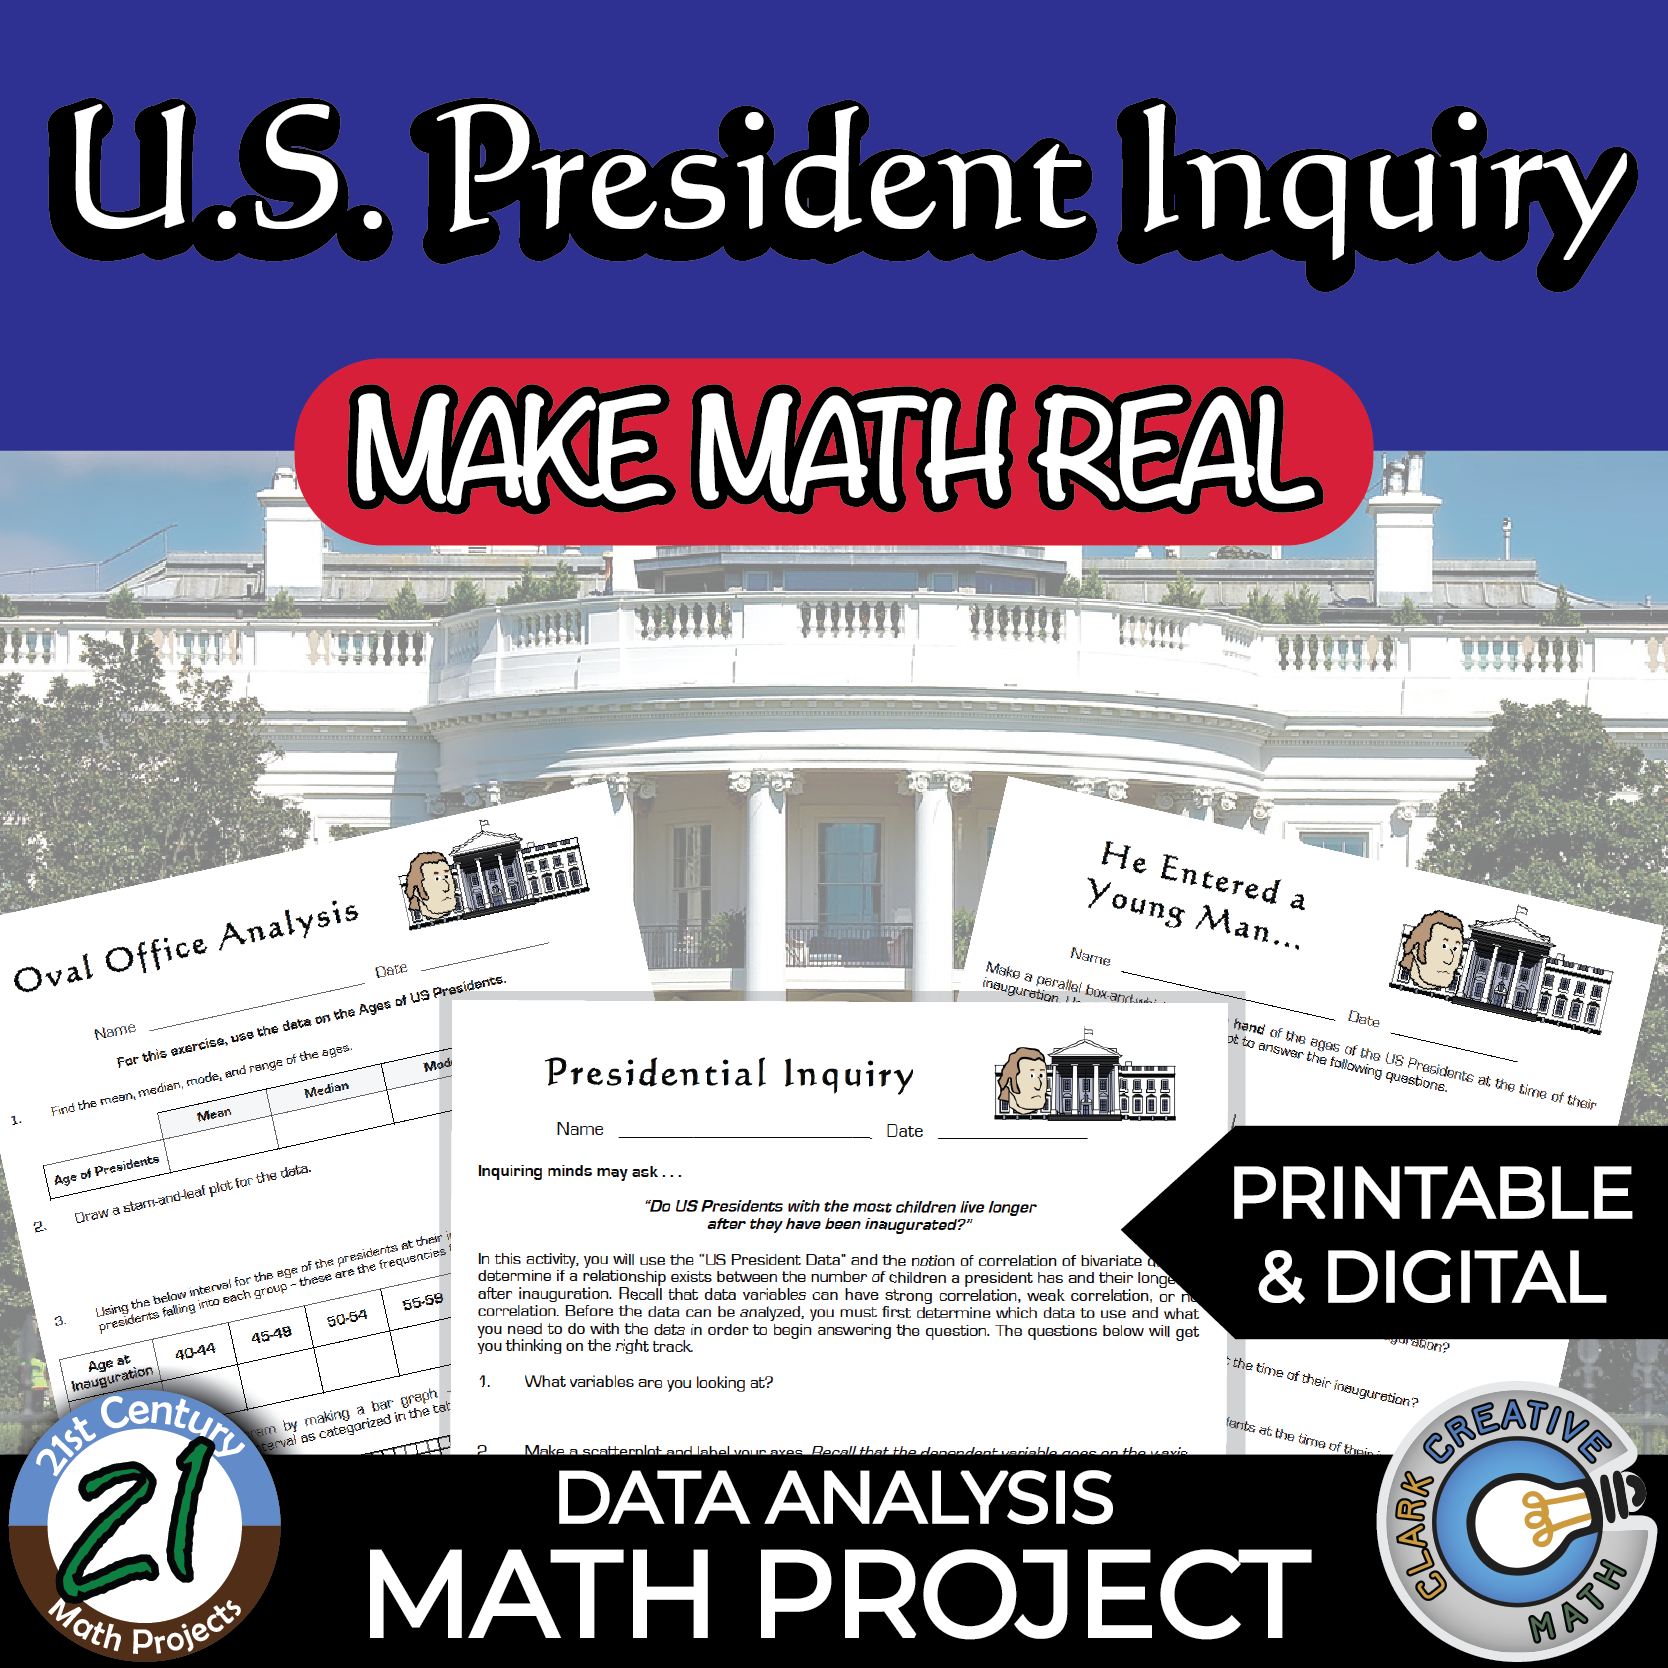
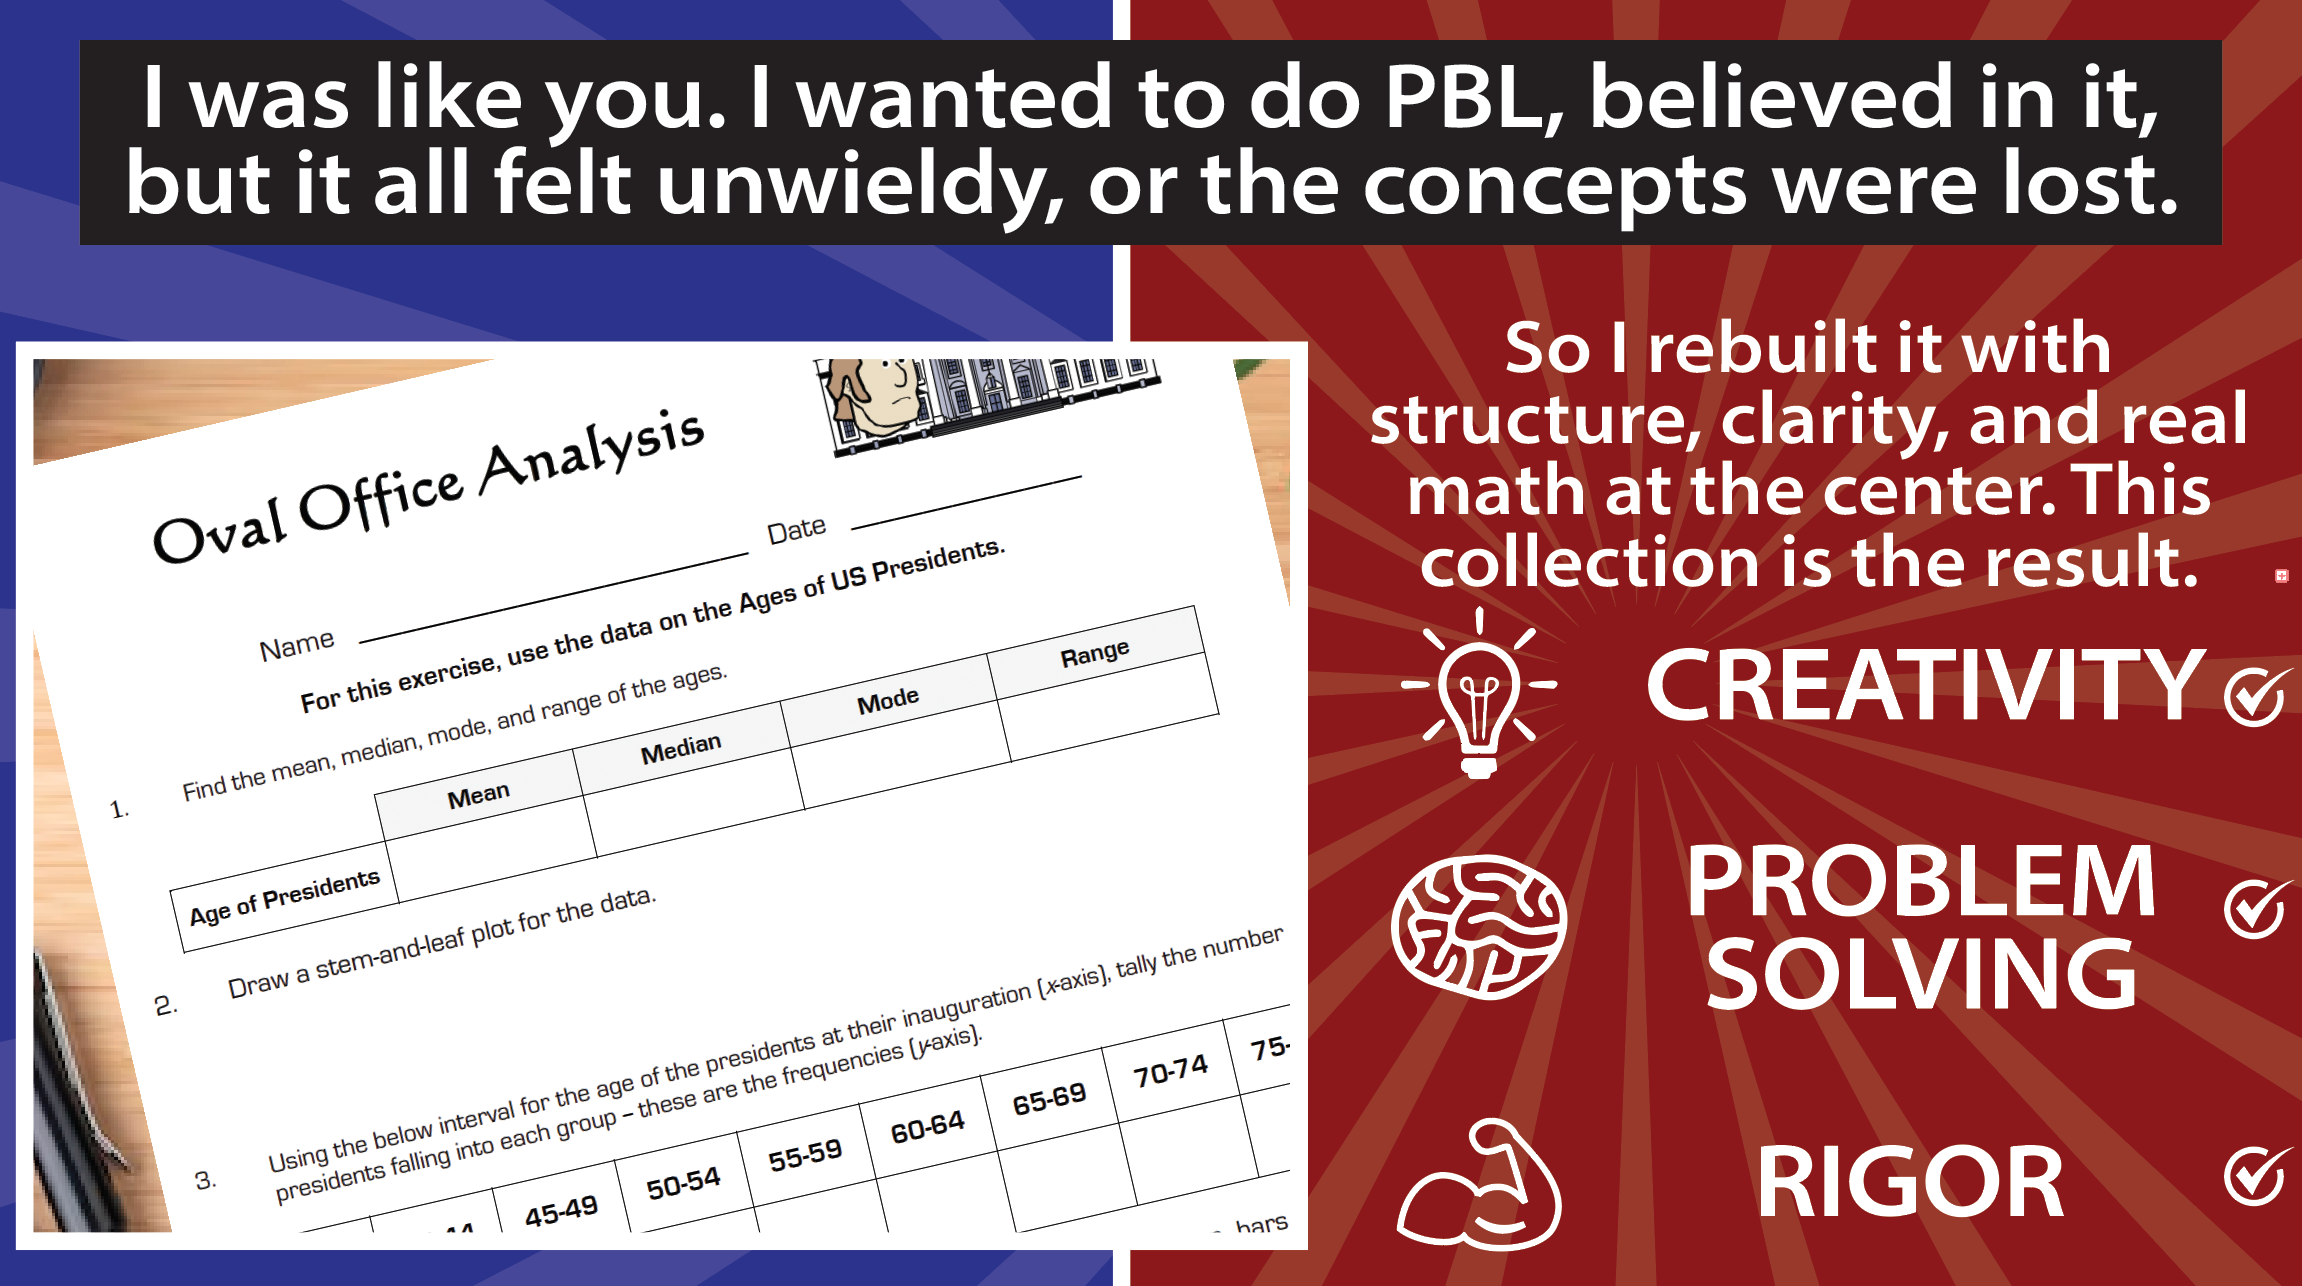
US President Data Analysis – Statistical Inquiry
Students analyze historical presidential data using statistical tools to investigate trends and patterns.
Rather than calculating statistics mechanically, students interpret real political data.
Concepts Covered:
- Mean, median, and mode
- Data interpretation with a variety of plots
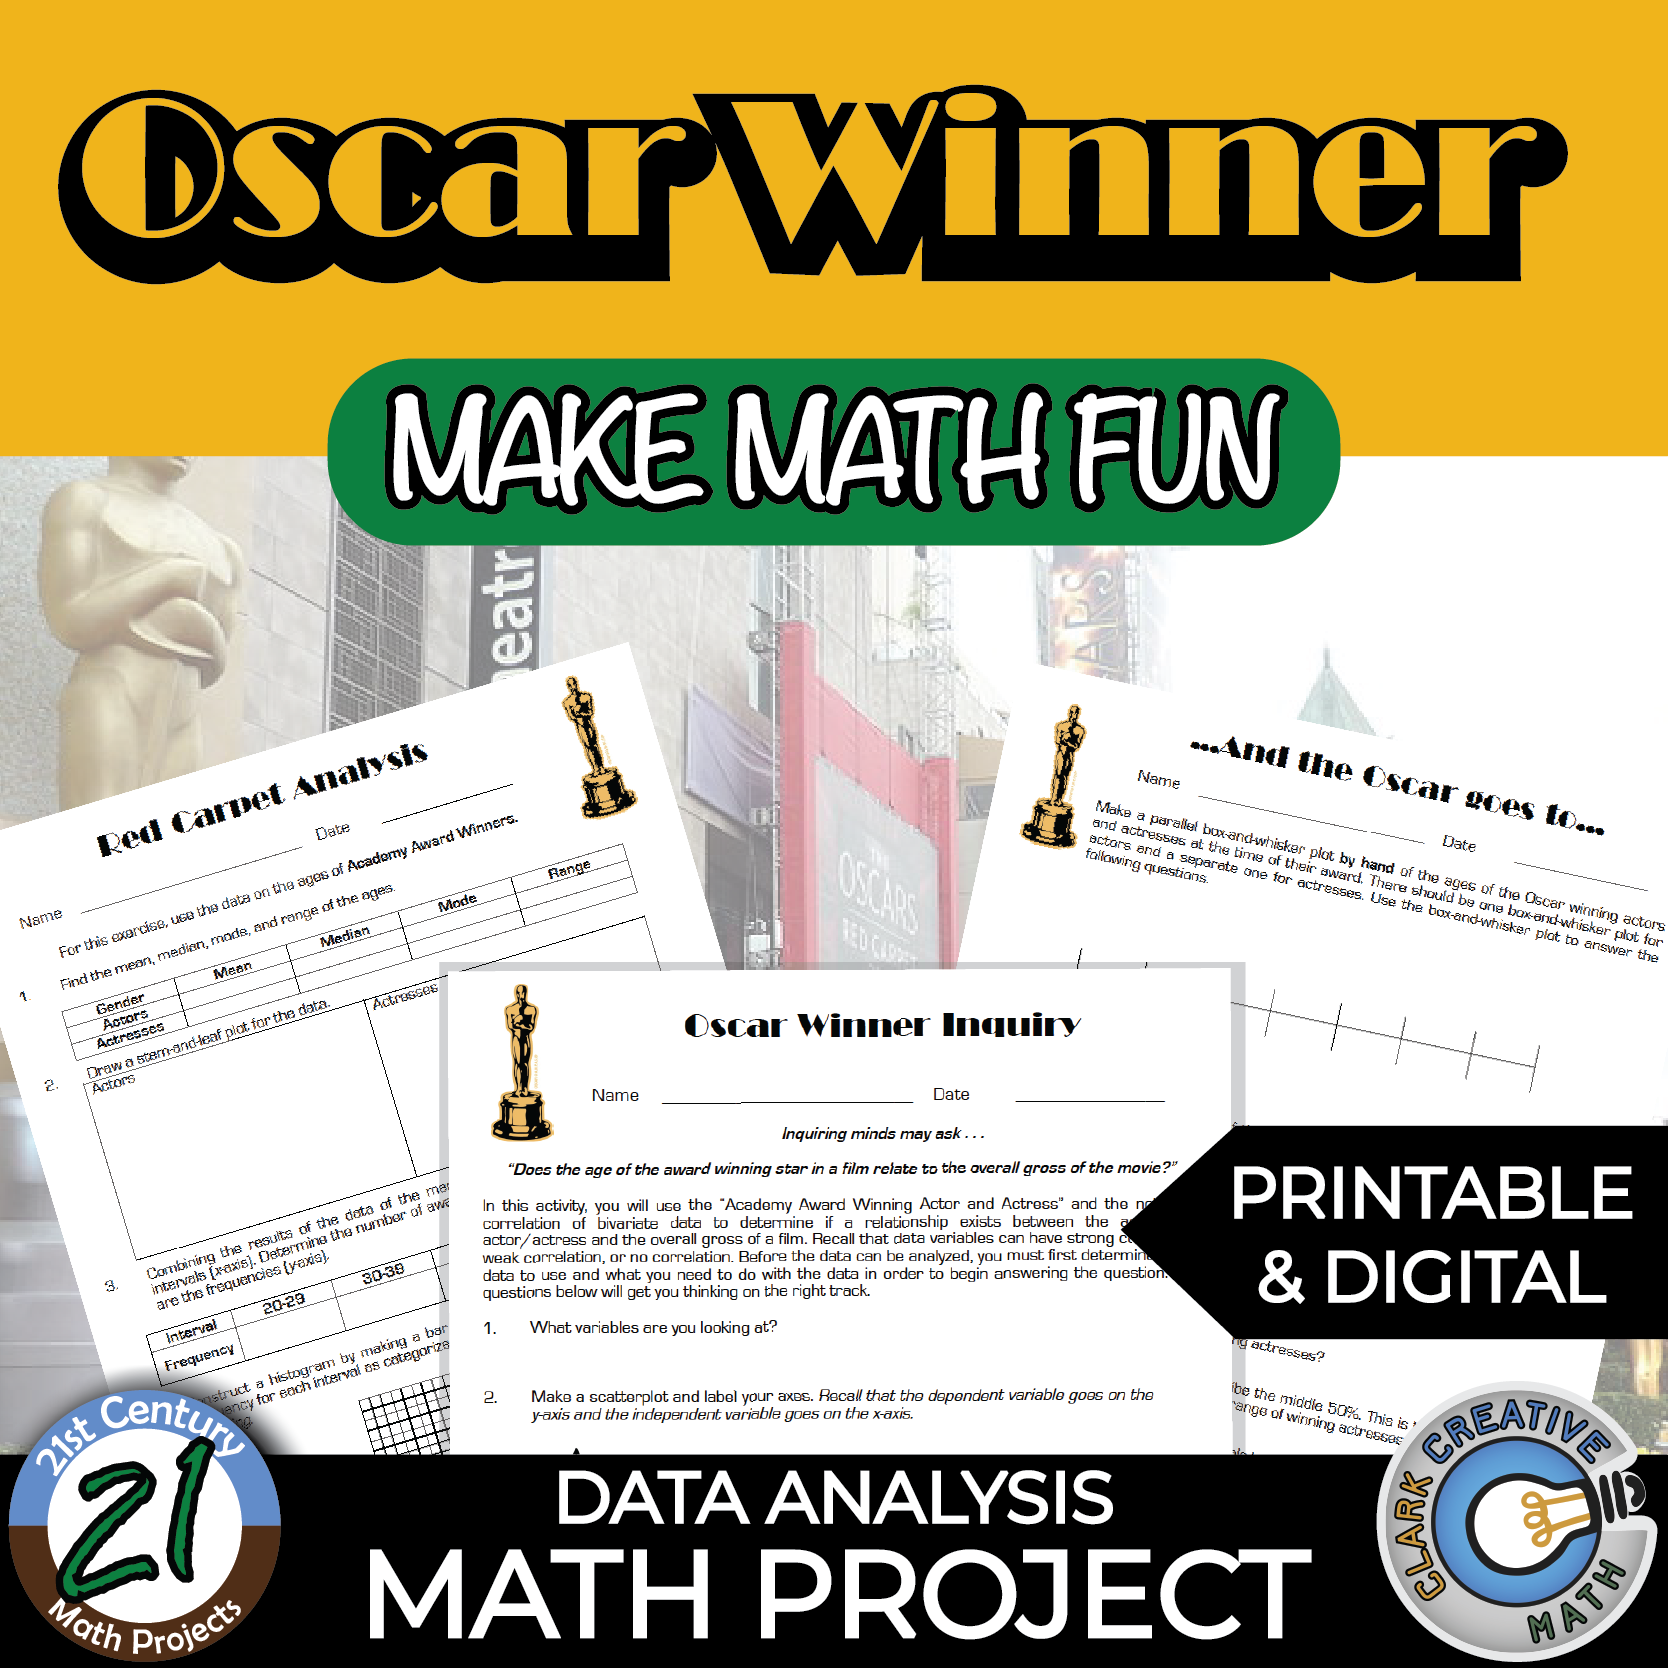
Oscar Winner Data Analysis – Statistics Inquiry
Students analyze Academy Award data to uncover trends and statistical patterns.
This project reinforces statistical reasoning in a culturally engaging context.
Concepts Covered:
- Measures of center
- Varieties of data plots
Measures of Center & Variation Projects
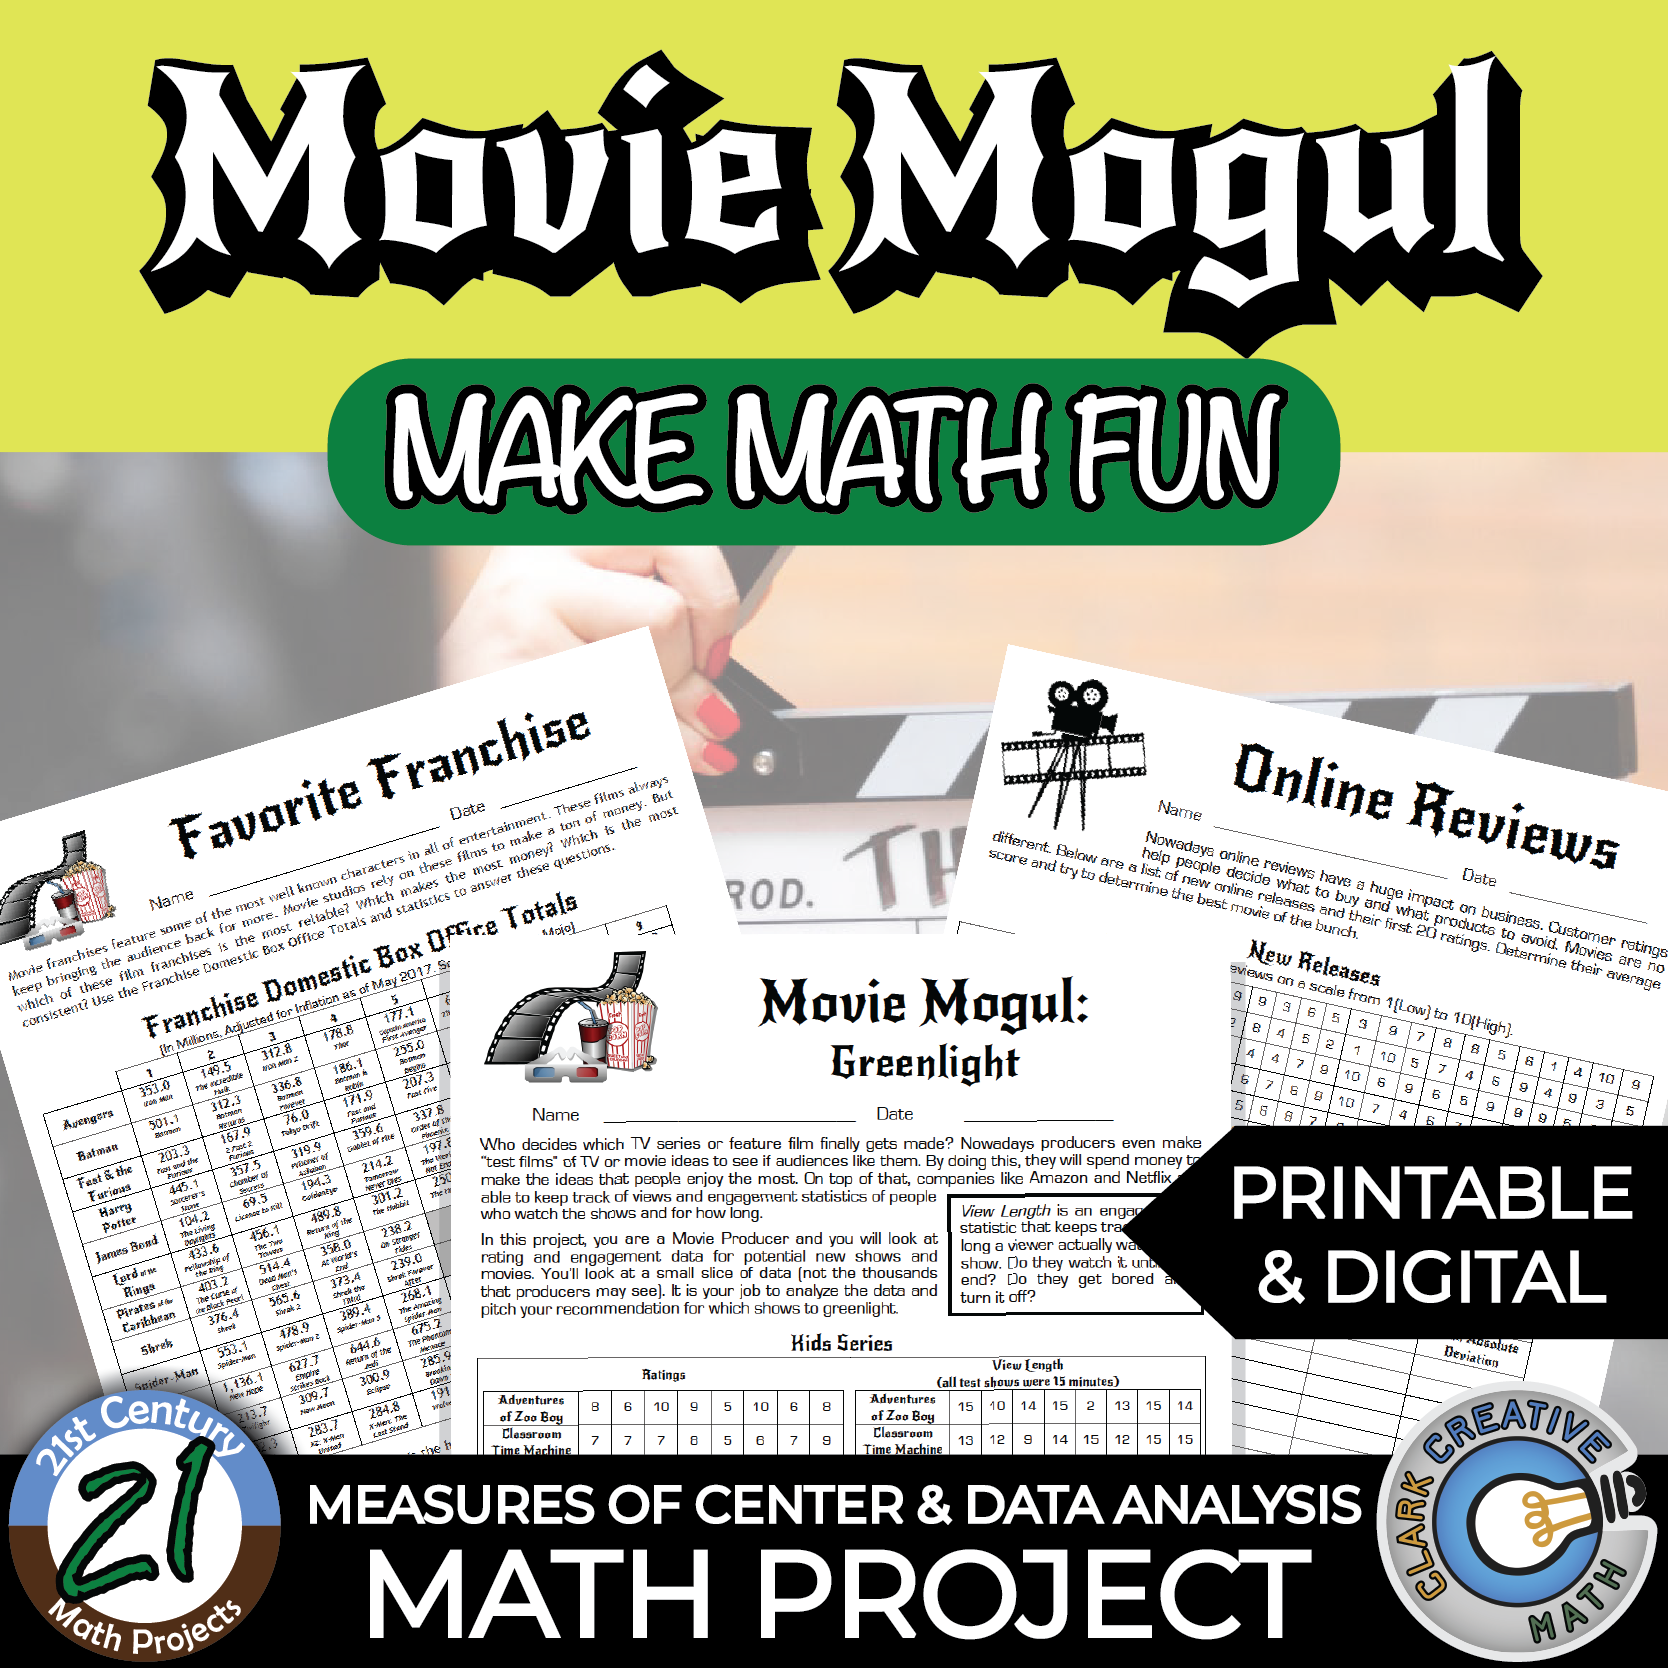
Movie Mogul – Mean, Median & Variation
Students analyze movie revenue data to evaluate financial performance using statistical measures.
They interpret spread and central tendency to make business conclusions.
Concepts Covered:
- Mean and median
- Range and variation
- Comparative data analysis
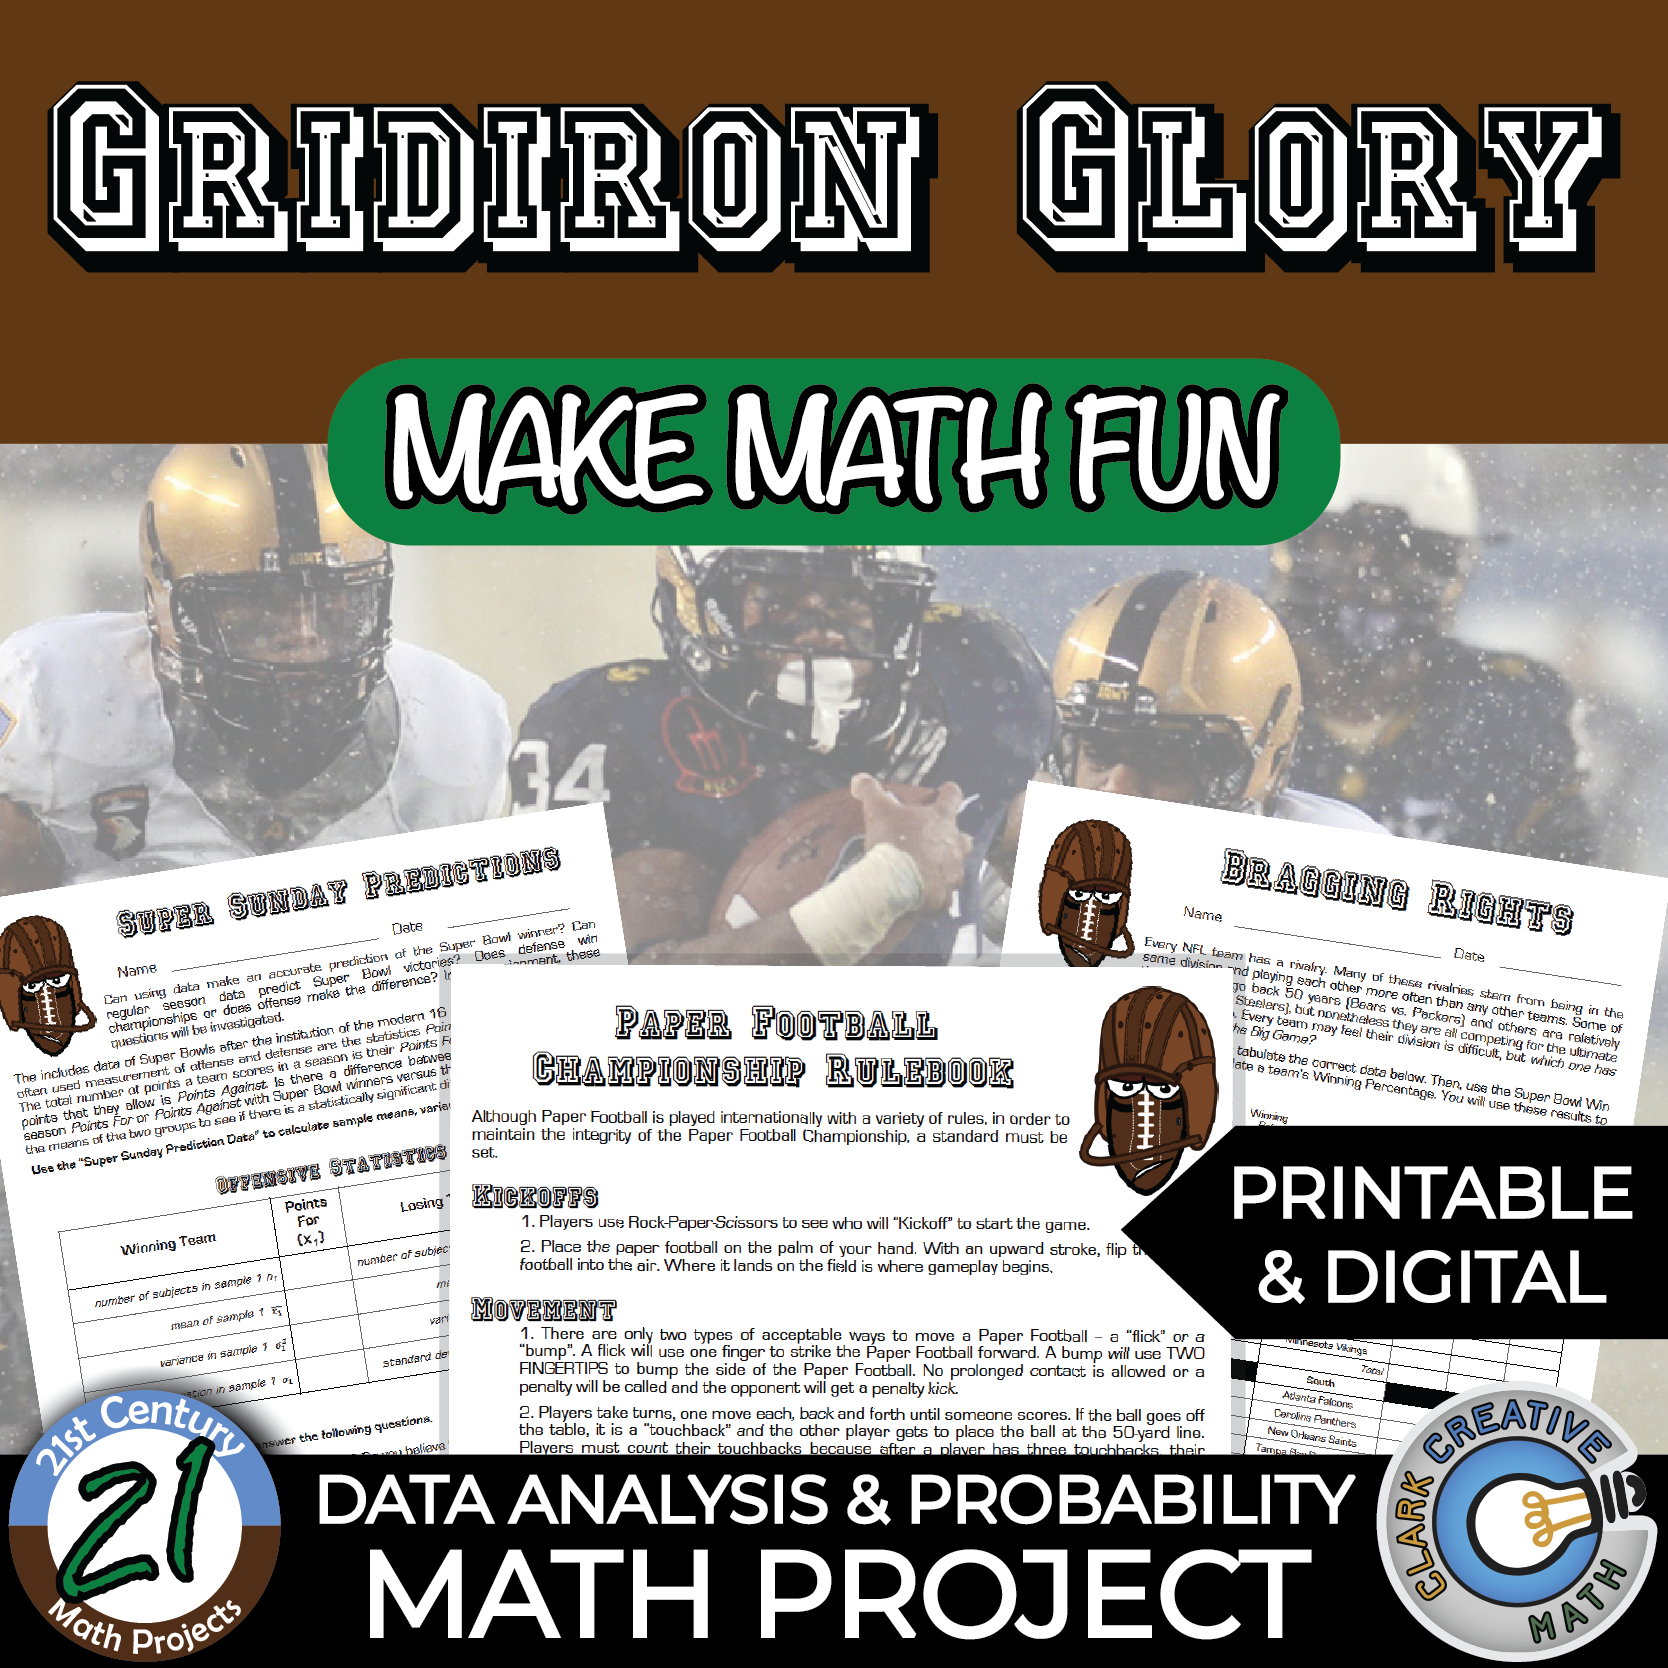
Gridiron Glory – Big Game Data Analysis
Students analyze football game statistics to evaluate performance trends and probability outcomes.
Concepts Covered:
- Data interpretation
- Statistical comparison
- Applied analysis
Probability Projects: Theoretical & Experimental
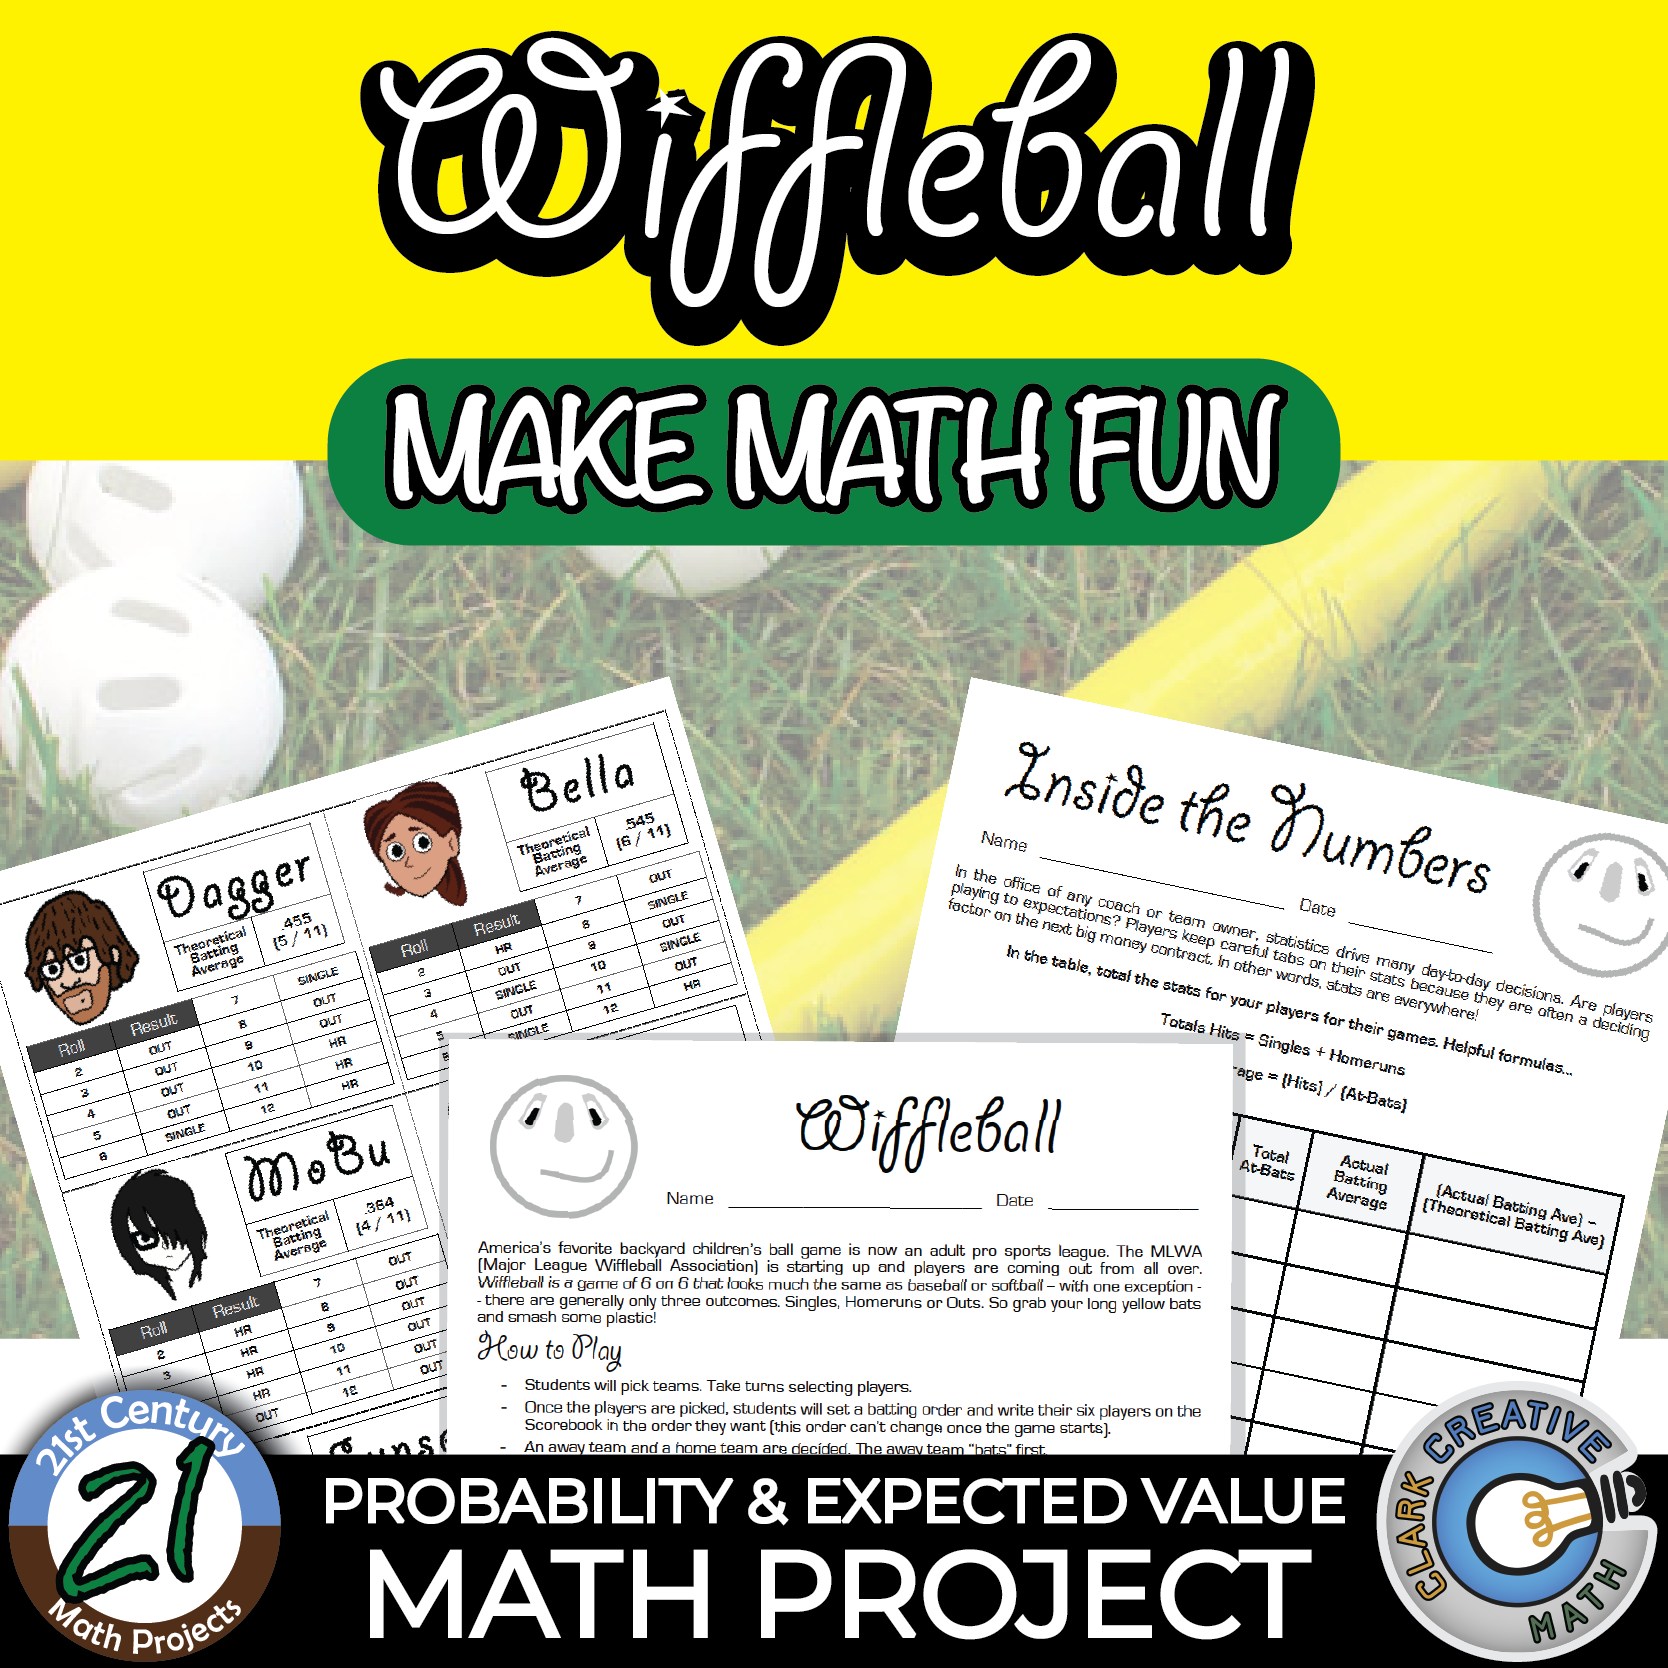
Wiffleball – Theoretical vs Experimental Probability
Students conduct experiments and compare experimental results to theoretical probability predictions.
They analyze variability and randomness through repeated trials.
Concepts Covered:
- Theoretical probability
- Experimental probability
- Relative frequency
- Data comparison
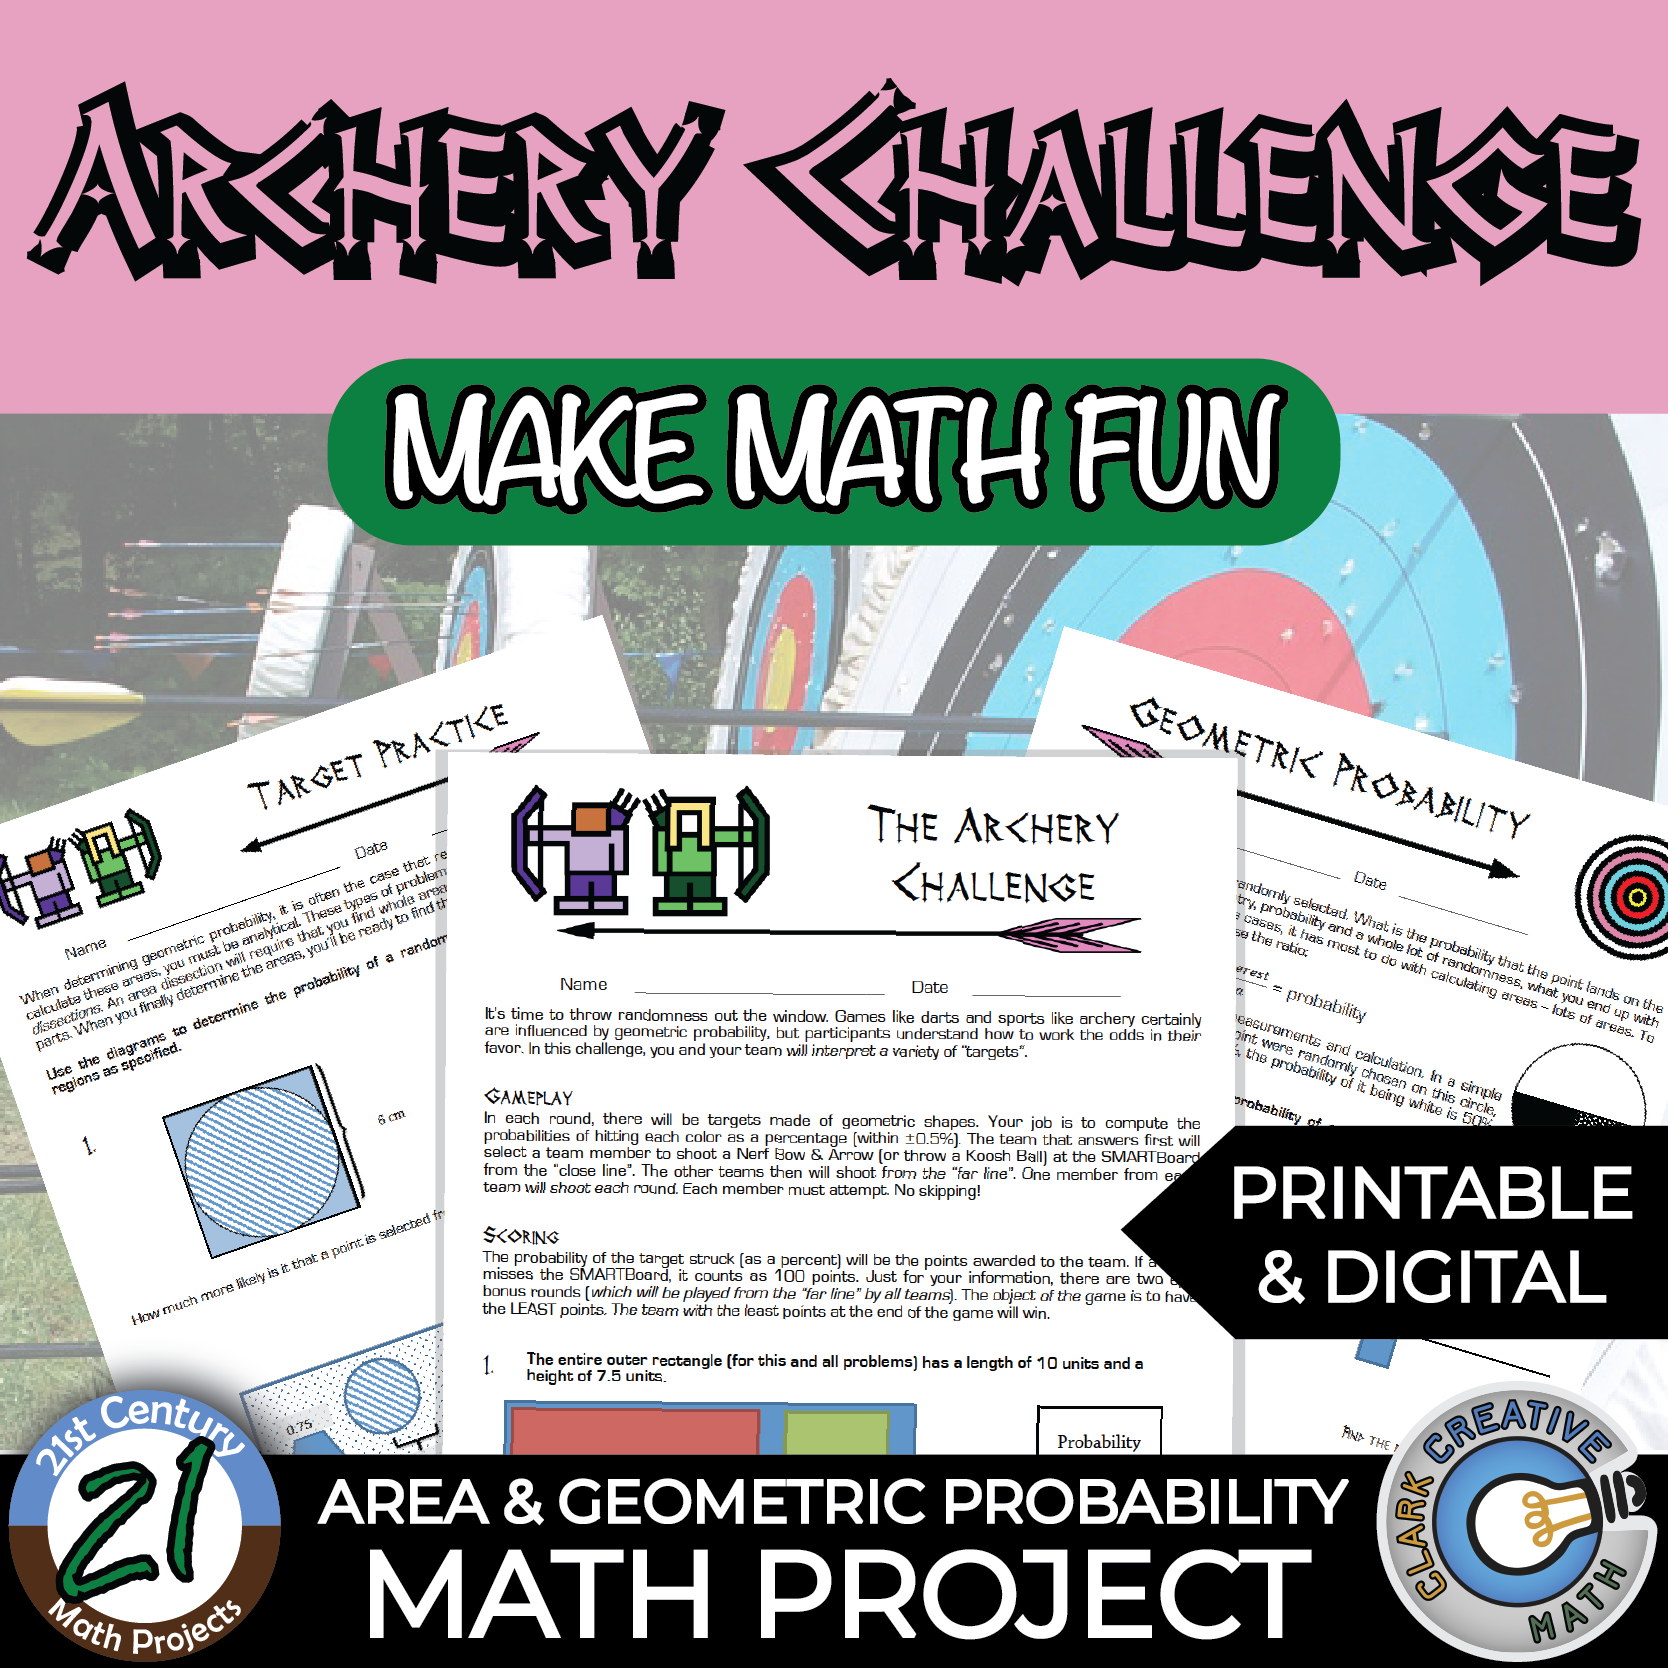
Archery Challenge – Geometric Probability
Students calculate probabilities using area ratios and geometric modeling.
Concepts Covered:
- Geometric probability
- Area-based modeling
- Experimental validation
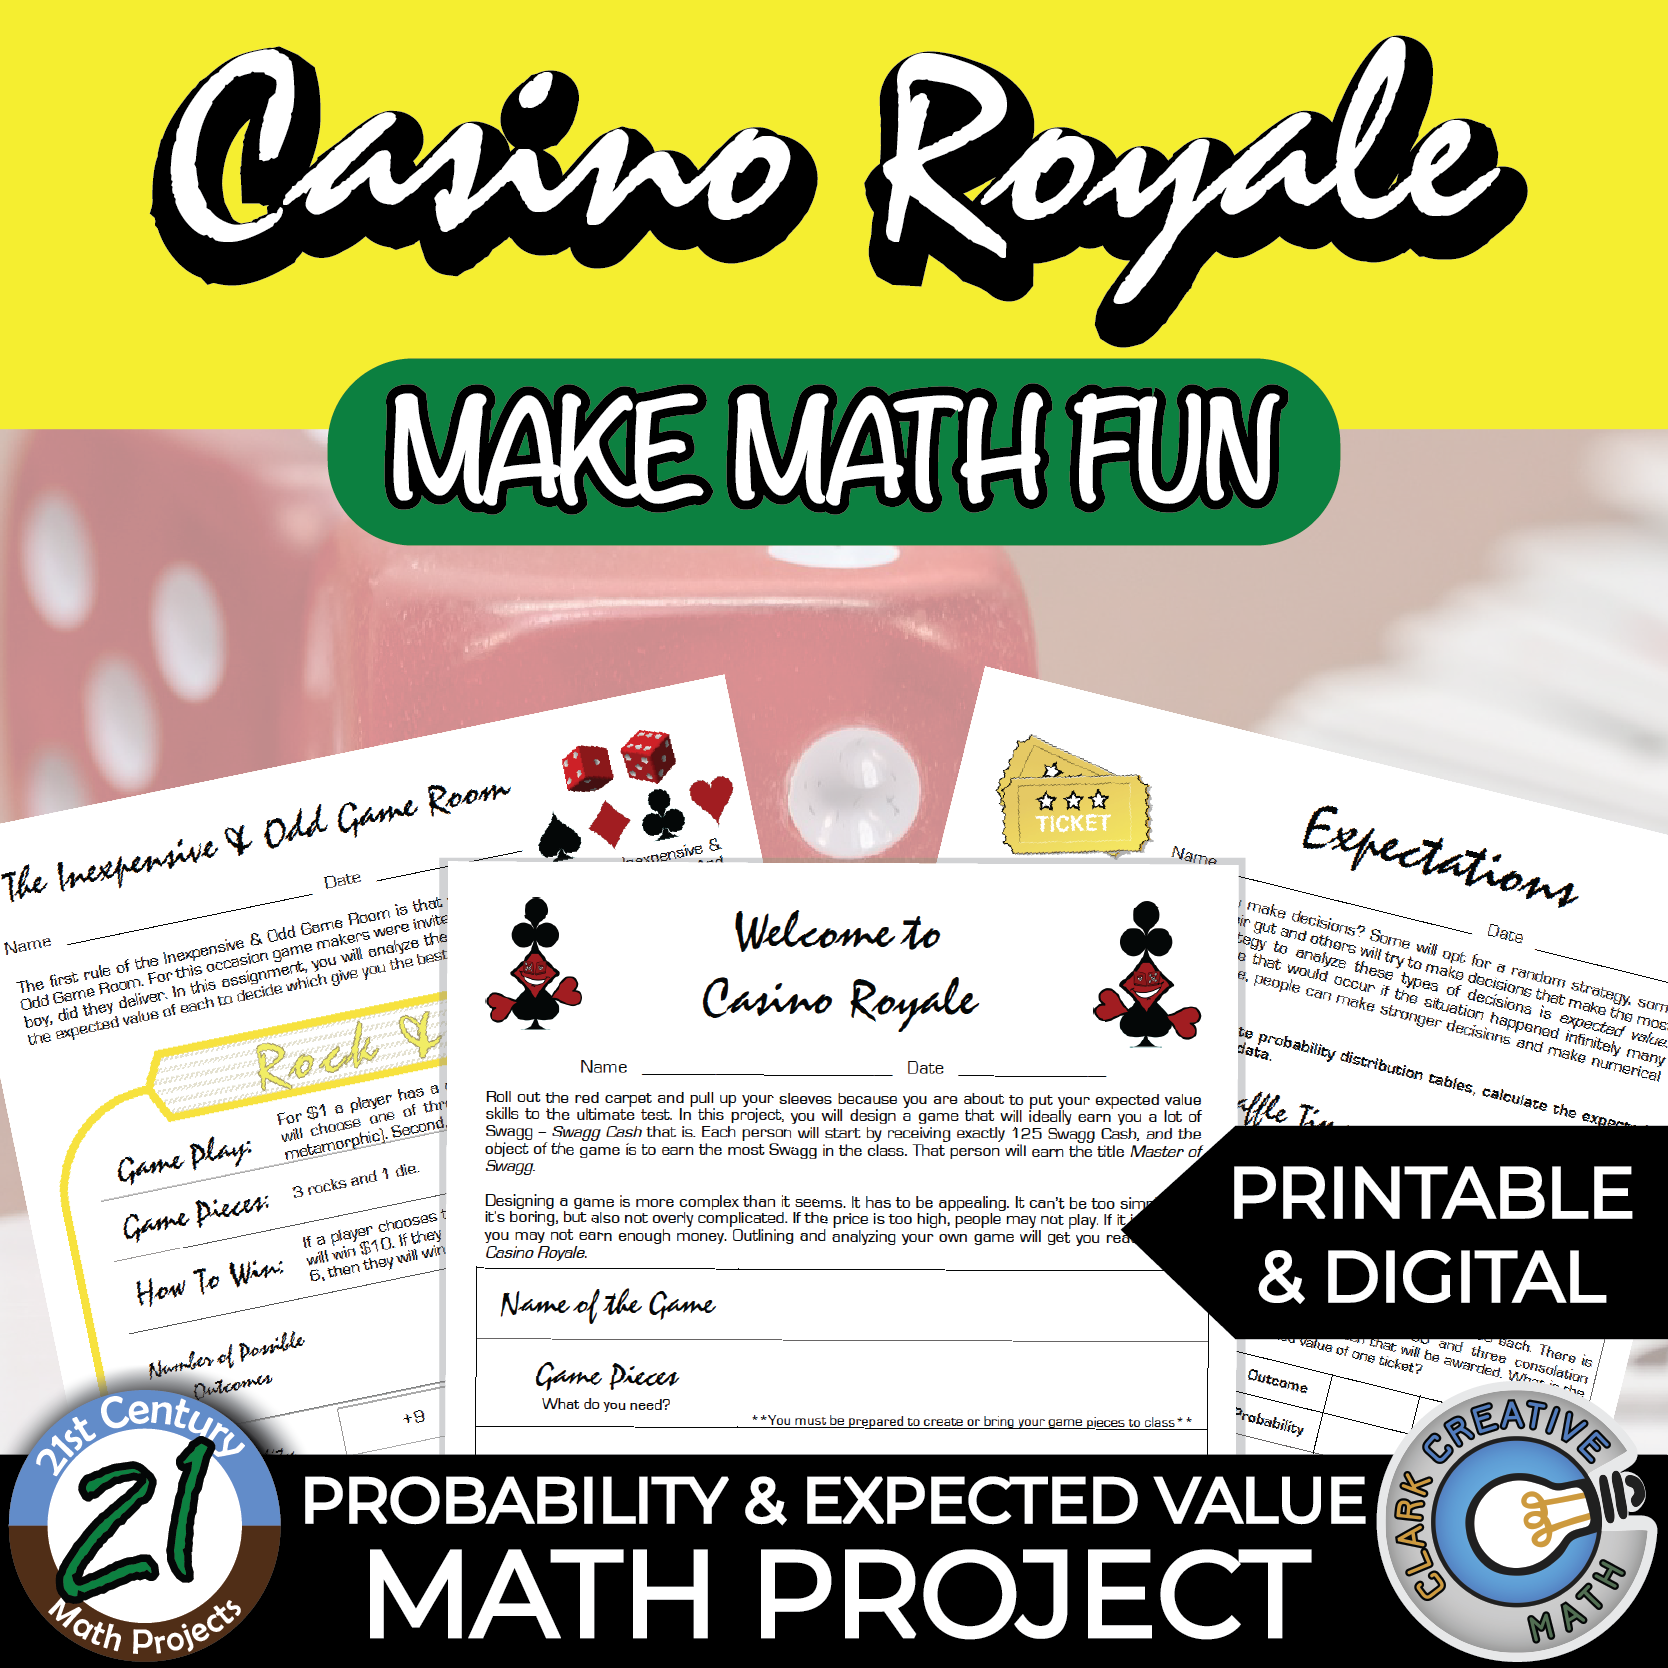
Casino Royale – Probability & Conditional Probability
Students analyze gambling systems using expected value and conditional probability to determine long-term fairness.
Concepts Covered:
- Expected value
- Conditional probability
- Risk analysis
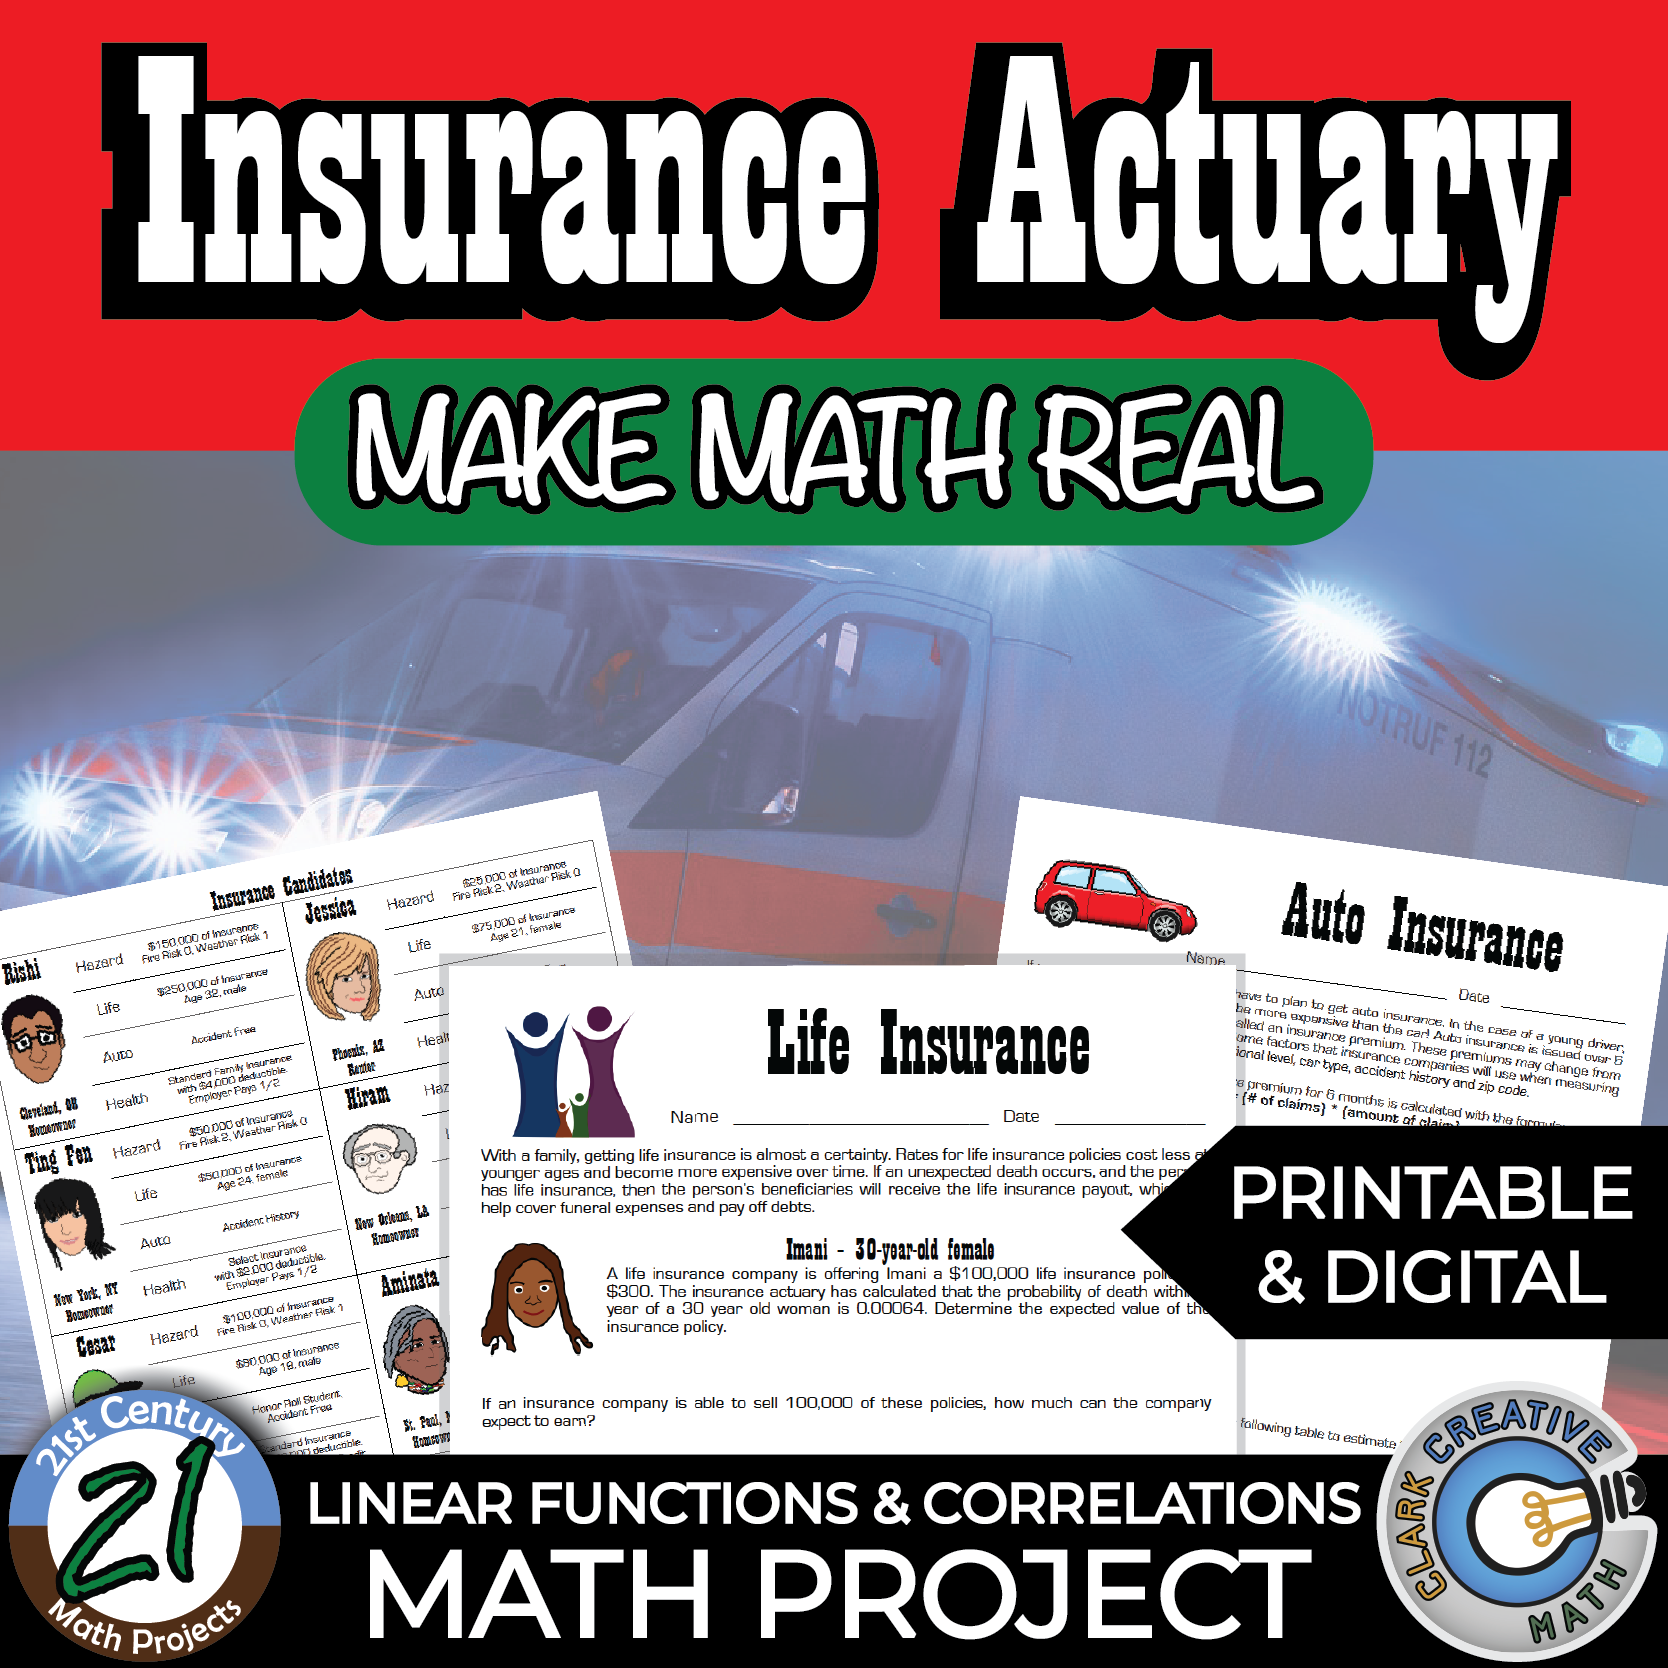
Insurance Actuary – Expected Value & Risk Analysis
Students calculate expected value to determine sustainable insurance premiums and analyze financial risk scenarios.
Concepts Covered:
- Expected value
- Risk modeling
- Probability reasoning
Combinatorics & Counting Principles
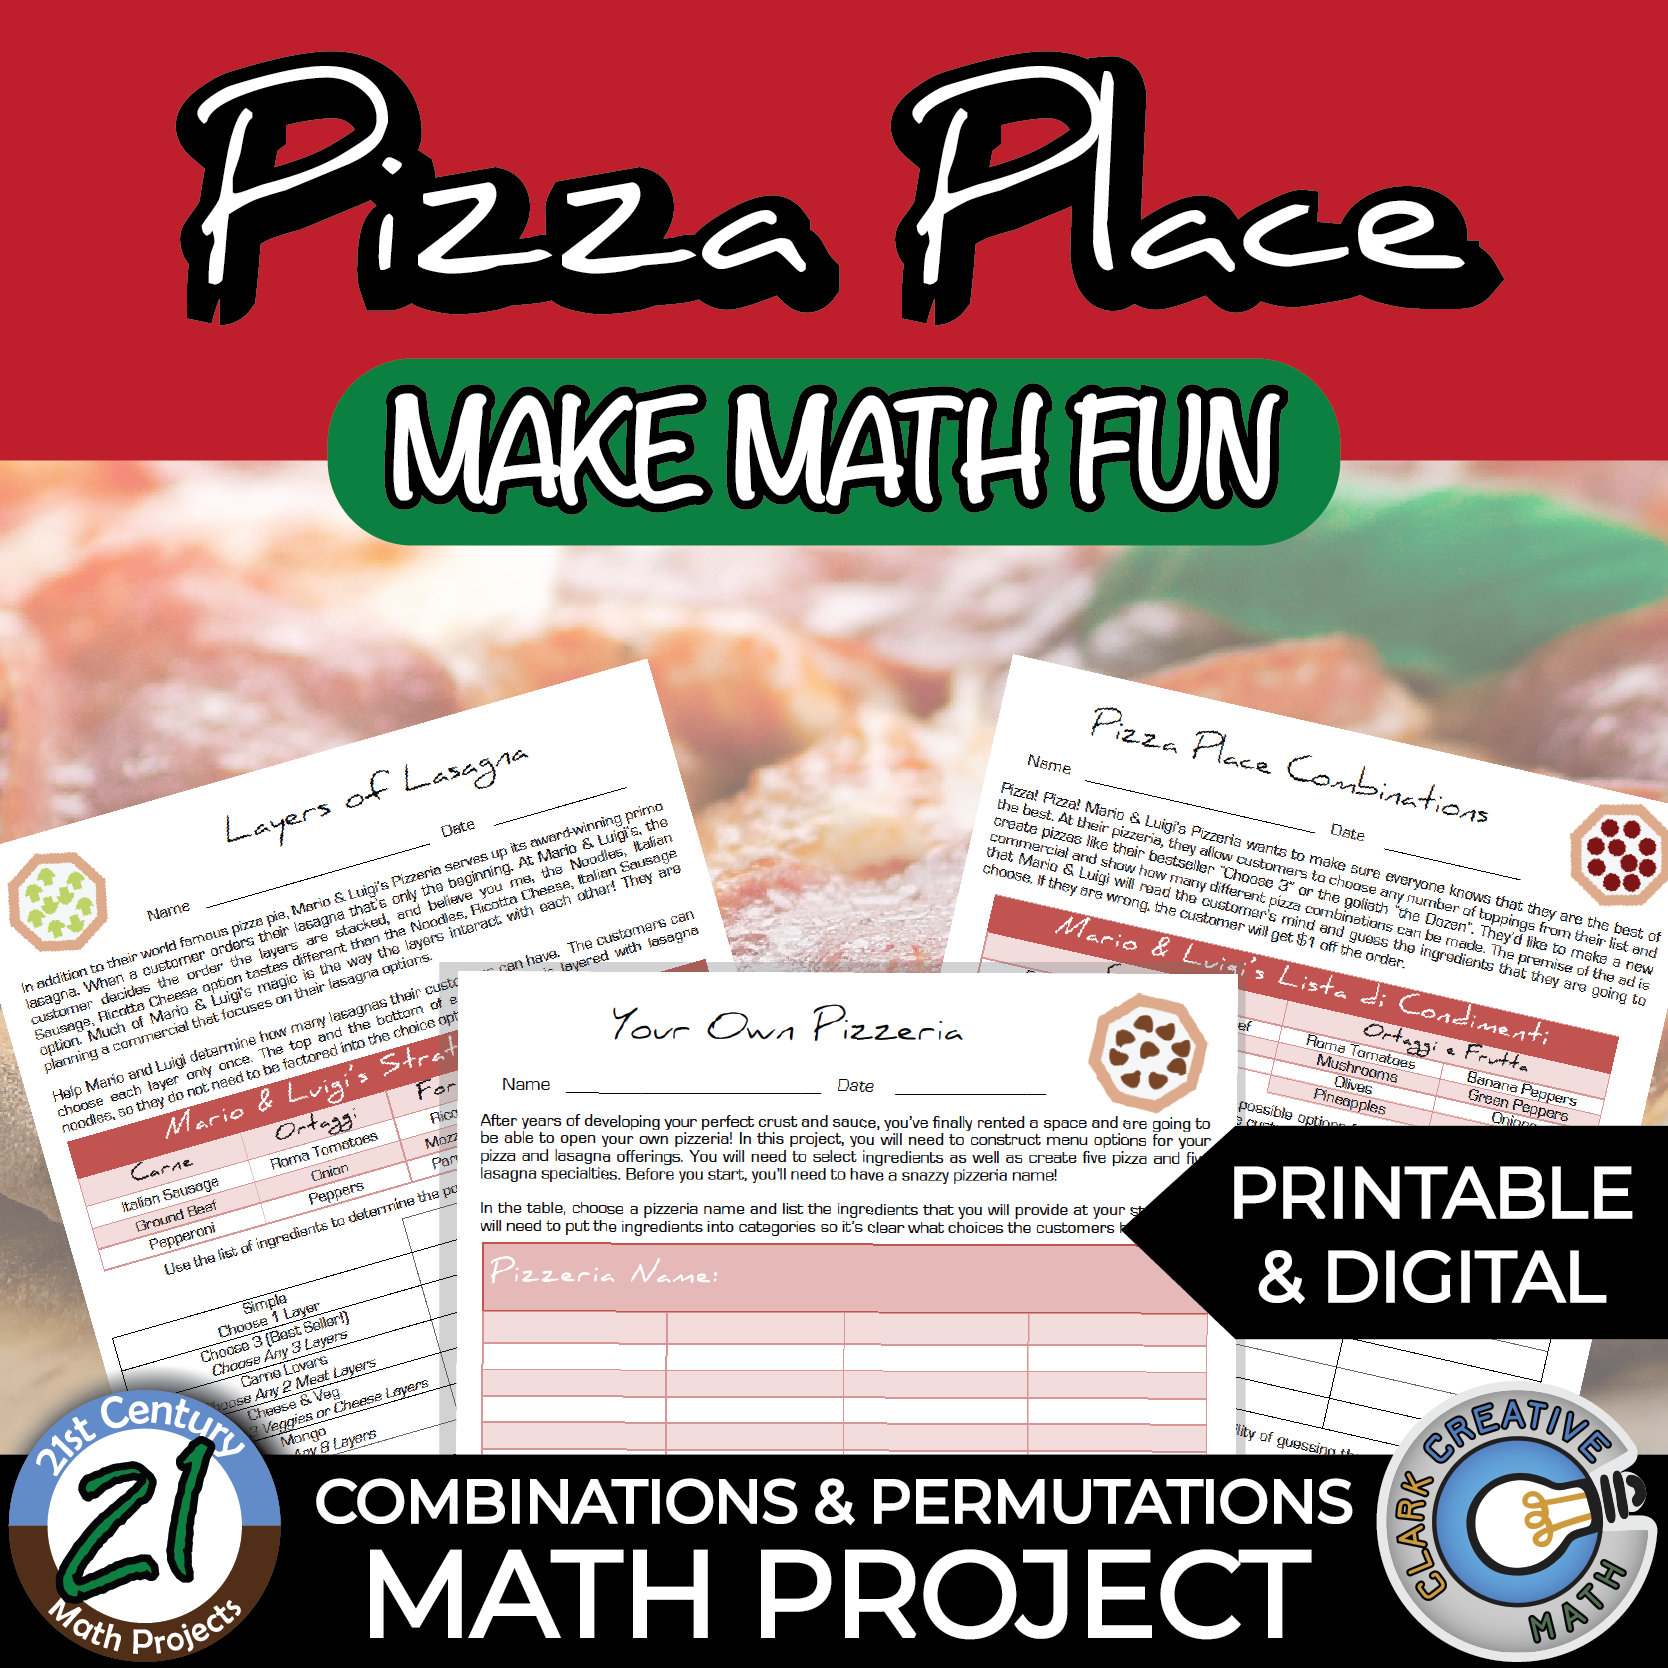
Pizza Place – Combinations & Permutations
Students calculate possible pizza combinations and permutations based on topping selections.
Rather than memorizing formulas, students model real ordering scenarios.
Concepts Covered:
- Permutations
- Combinations
- Fundamental counting principle
Correlation & Regression Projects
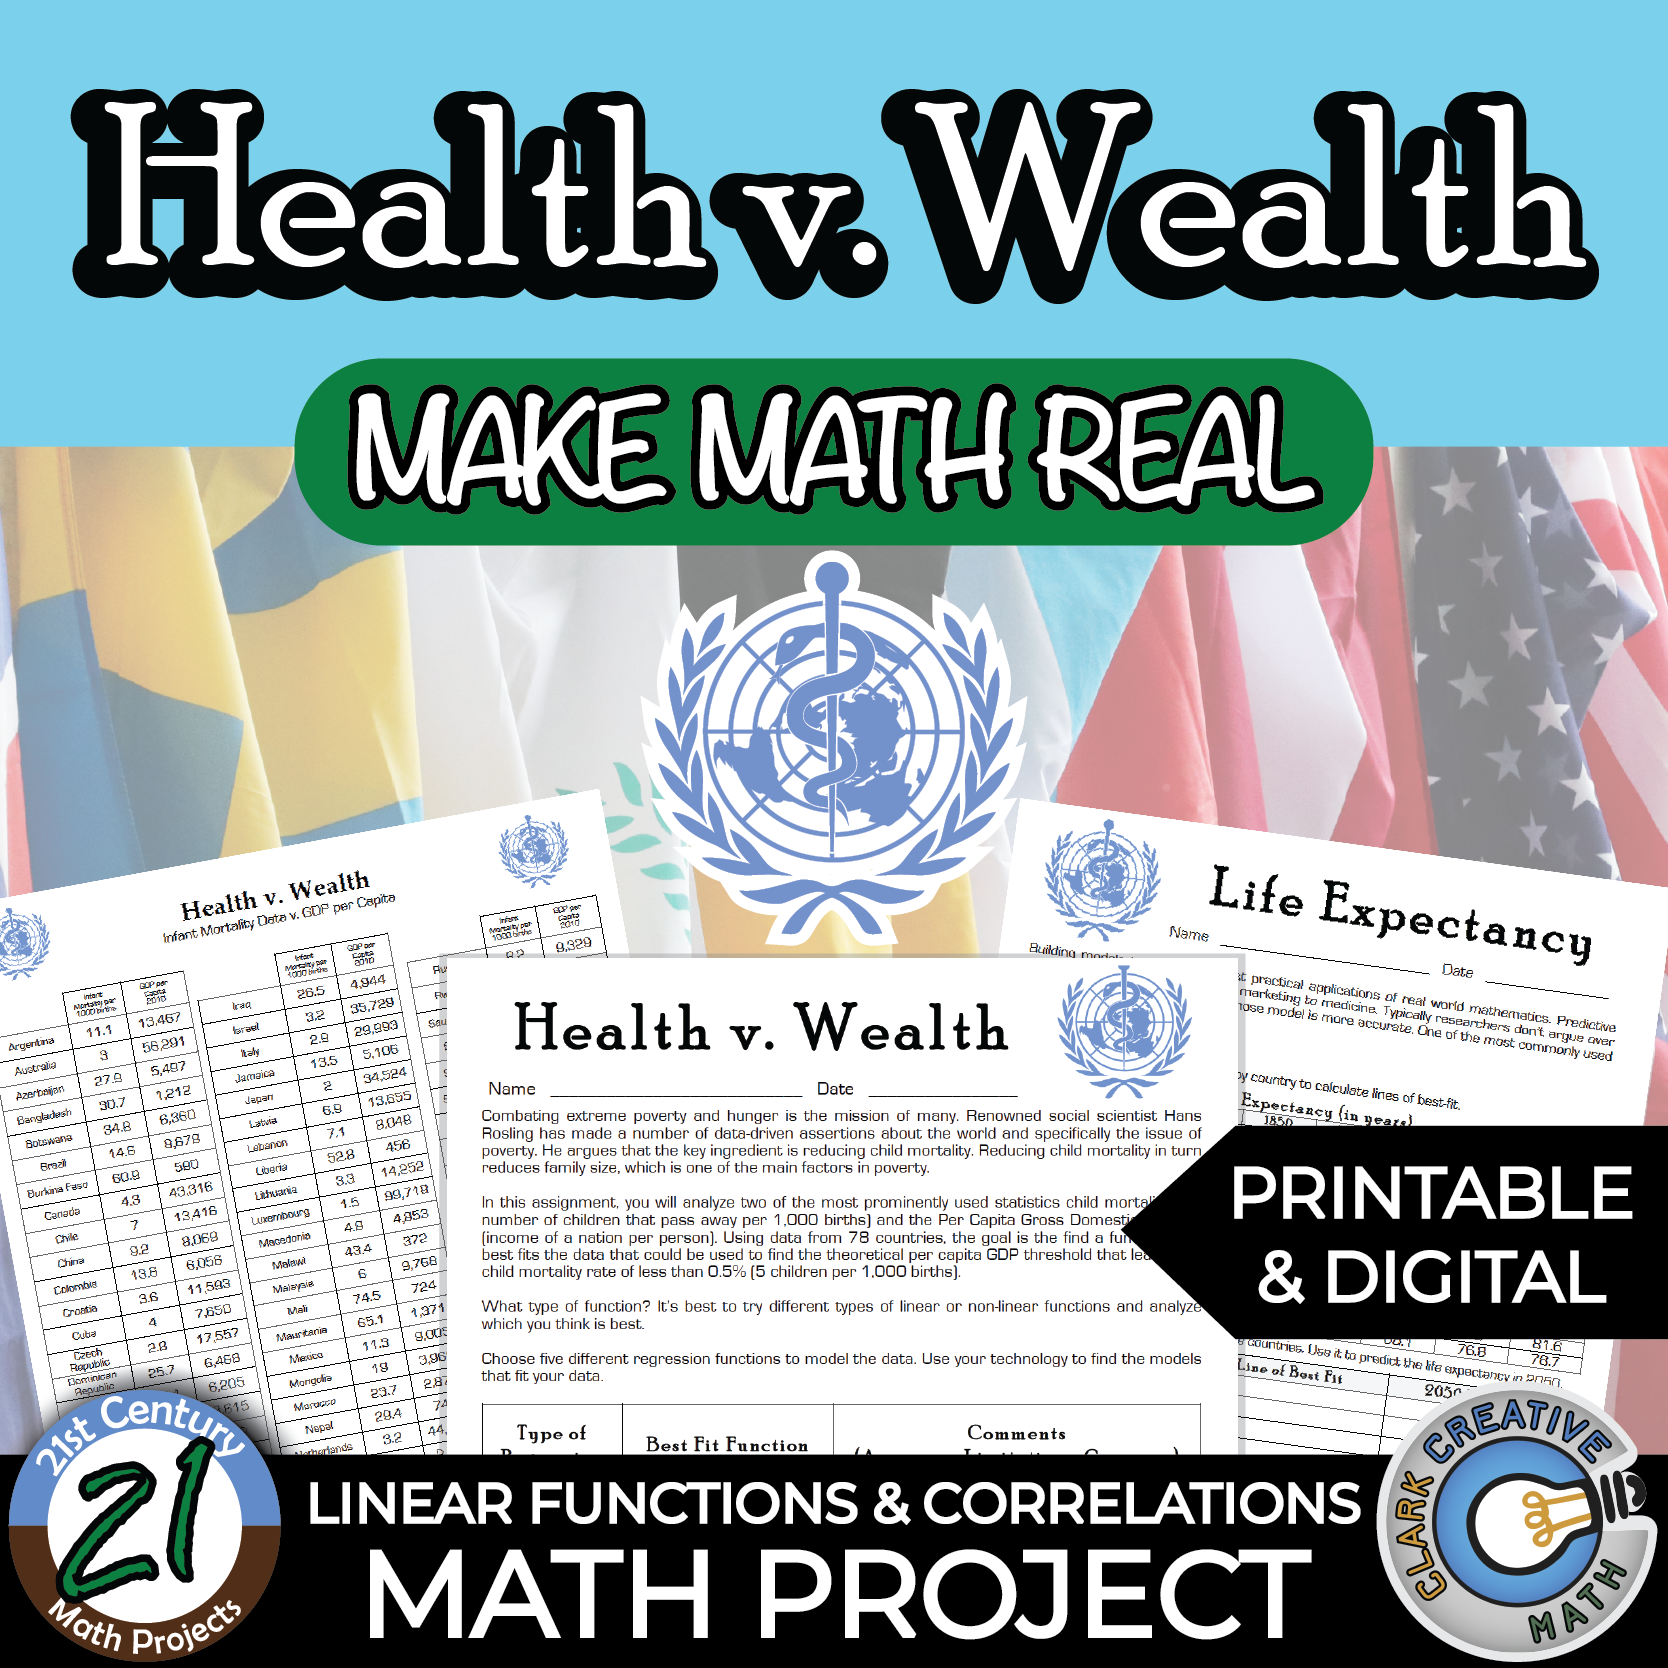
Health vs. Wealth – International Data & Correlation
Students analyze international economic and health data to determine relationships between variables.
Concepts Covered:
- Correlation
- Regression
- Interpretation of trends
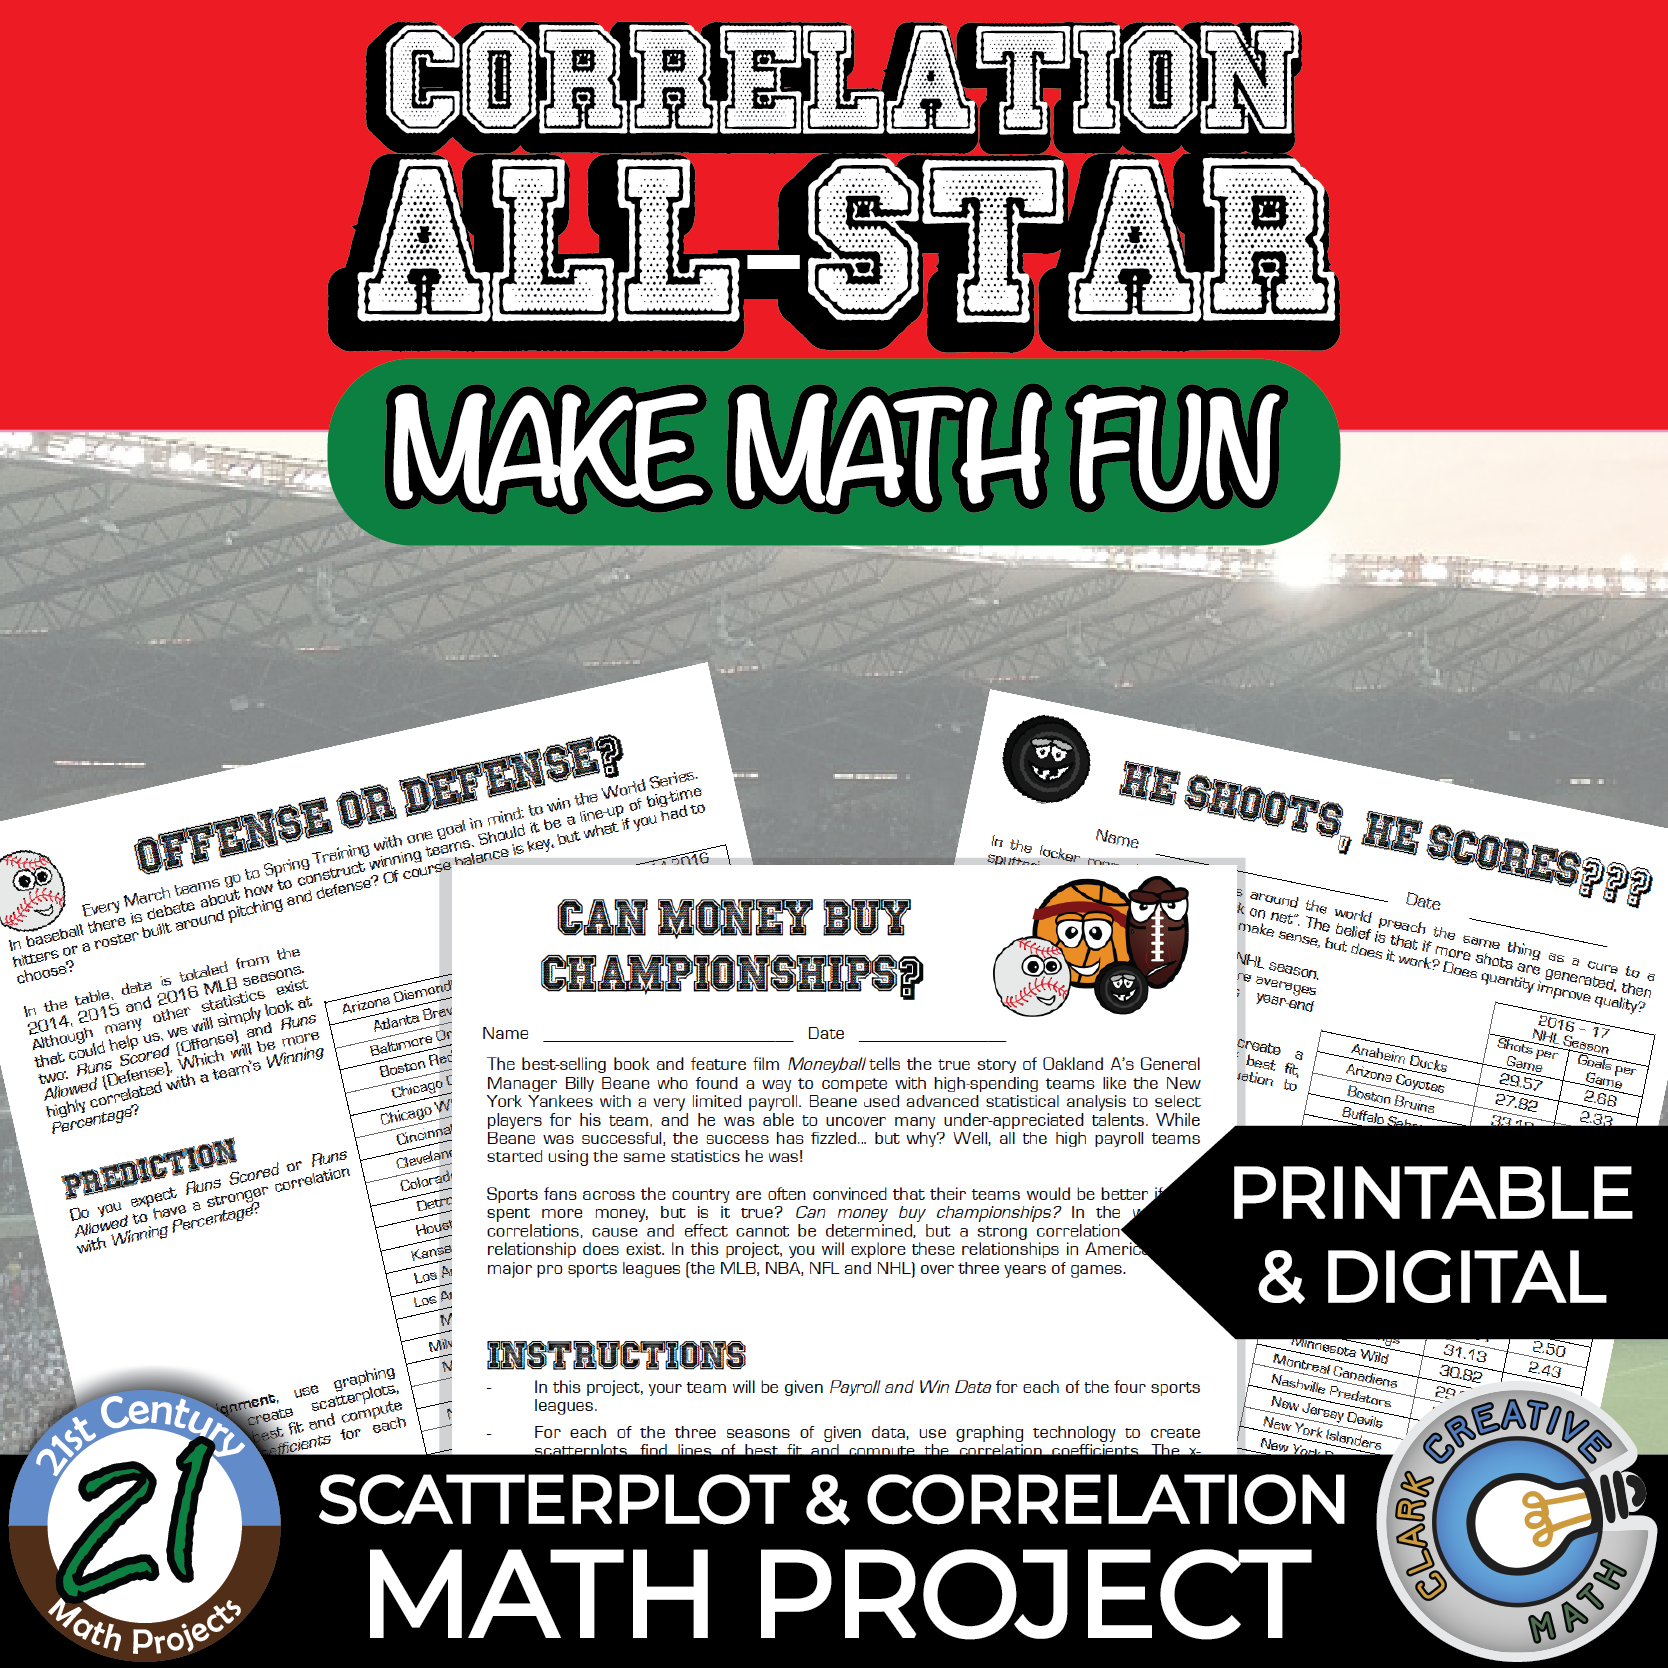
Correlation All-Star – Sports Data Analysis
Students analyze sports performance data to determine correlation strength and interpret scatterplots.
Concepts Covered:
- Correlation
- Scatterplots
- Line of best fit
- Interpretation of r-value
Hypothesis Testing & Statistical Inference
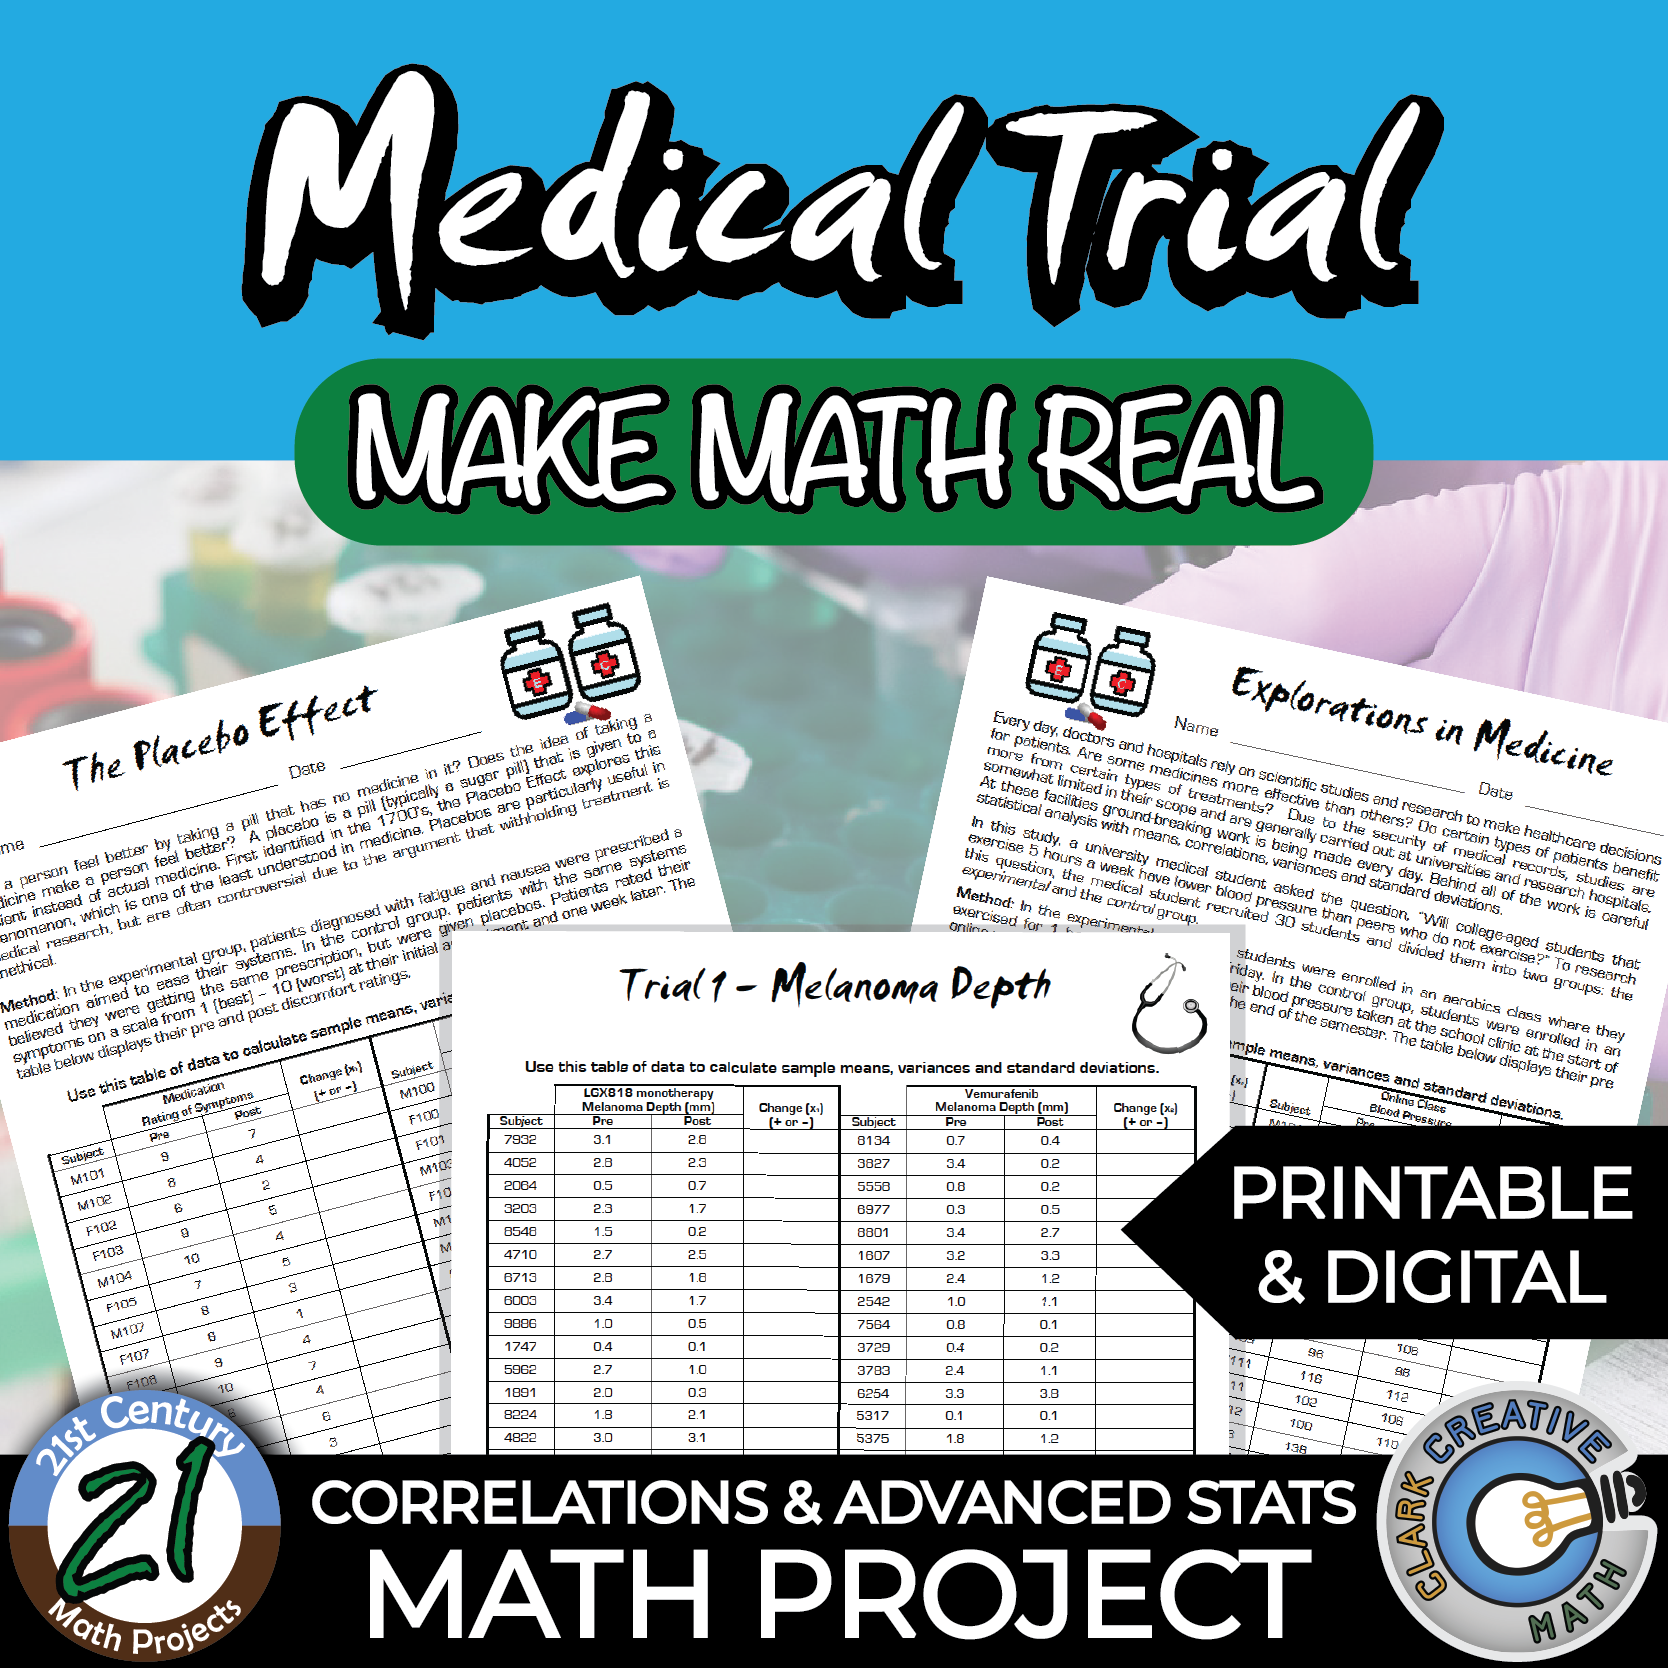
Medical Trial – Statistics & T-Test Analysis
Students analyze clinical trial data and conduct statistical hypothesis testing using t-tests.
They evaluate claims using formal statistical reasoning.
Concepts Covered:
- Hypothesis testing
- T-tests
- Statistical inference
- Evidence evaluation
Why Statistics & Probability Projects Increase Mastery
Statistics projects:
- Build critical thinking
- Develop evidence-based reasoning
- Strengthen interpretation skills
- Increase engagement through real data
- Prepare students for college-level statistics
When students analyze sports data, survey classmates, evaluate gambling fairness, or test medical claims, statistics becomes powerful.
How to Successfully Implement Data & Probability PBL
To maximize impact:
- Scaffold the math to get slowly more abstract (like it is in the real world)
- Break it into smaller components
- Allow students creative freedom as you go
- Encourage evidence-based decision making
Statistics thrives when students question results rather than simply compute them.
Looking for More Math Projects?
If you’re exploring broader project-based learning ideas beyond financial literacy, you may also enjoy:
- Creative High School Math Projects That Make Algebra, Geometry & Statistics Come Alive
- Algebra 1 Projects: Real World & Engaging PBL Ideas for High School
- Geometry Projects for High School: Real World & STEM PBL Ideas
- Algebra 2 & Precalculus Projects: Advanced Real World Math Ideas
- Financial Literacy Math Projects for High School
- Middle School Math Projects That Make 6th–8th Grade Math Feel Real
Explore our complete collection of high school math projects to bring purpose and engagement into your classroom.